Seasonal Trading Introduction: Traditional Charts
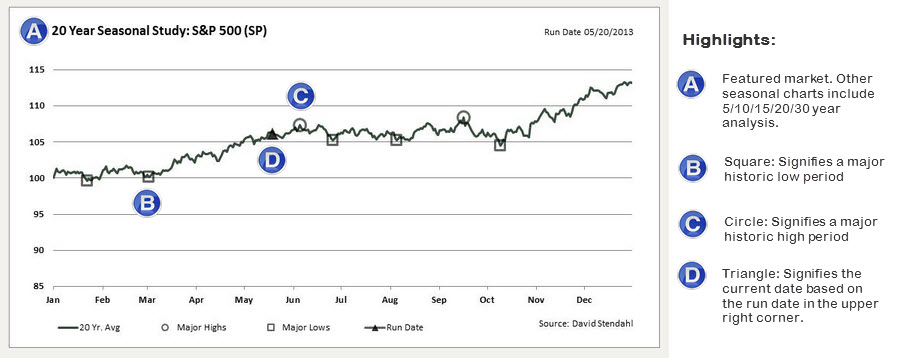
The traditional seasonal charts focus on all of the major turning points for the featured market. The triangle shows the current date as it provides the location on the seasonal chart. The seasonal chart below centers on a 20 year average, but in total we provide seasonal chart that span 5/10/15/20/30 yearly averages. Each chart has its own seasonal turning points so its a good idea to review all time periods. Markets that show turning points on a few seasonal charts may warrant closer attention and further analysis.
Seasonal Introduction Menu: