Seasonal Trading Introduction: Projection Charts
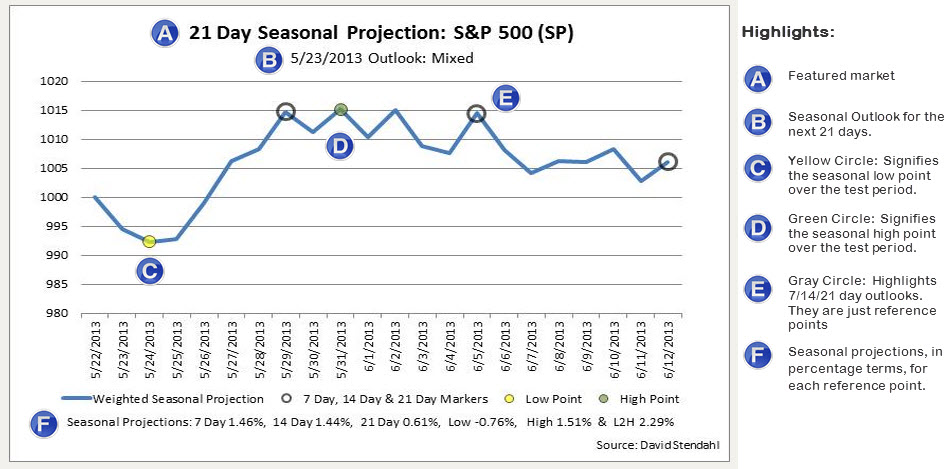
The final set of charts focus on seasonal projections for the featured market. The seasonal projection is a weighting of four historic seasonal averages for S&P 500 Index . Specifically, we combine the 5/10/15/20 yearly averages to form a single seasonal line. This seasonal weighted line (shown in blue) is then projected forward 21 calendar days from the outlook run date. Grey circles provide perspective for potential 7/14/21 day return projections. Low and high points over the 21-day period are highlighted in yellow and green respectfully, pointing out potential returns. The final return figure listed on the chart relates the Low to High (L2H) point or High to Low (H2L) point depending upon the Low/High historic order. Each of these return figures are posted at the bottom of the chart and should be used strictly for reference purposes only.
Seasonal Introduction Menu: