Seasonal Trading Introduction: Top Ten List
This study reviews top markets that are accurately tracking any of four separate seasonal time frames. Specifically, the markets current annual performance is compared against the markets 5/10/15/20 seasonal charts. Markets that are closely tracking 3 or more seasonal time frames are displayed. The key is to closely monitor markets with a large number of accurate time frames combined with high correlation levels.
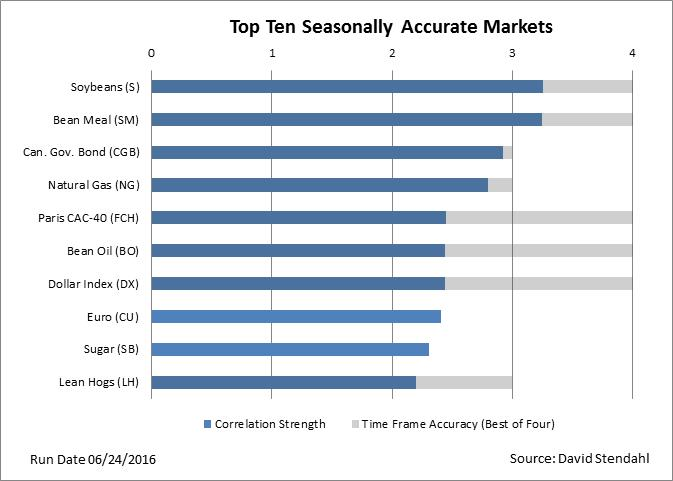
Chart Overview:
- The gray bar indicates the number of time frames that are currently in a high correlation stage.
- The blue bar summarizes (with no scale) the total level of correlation across all time frames.
Sample Top Ten List
Seasonal Introduction Menu: