The trend is your friend … but sometimes it can go a little too far.
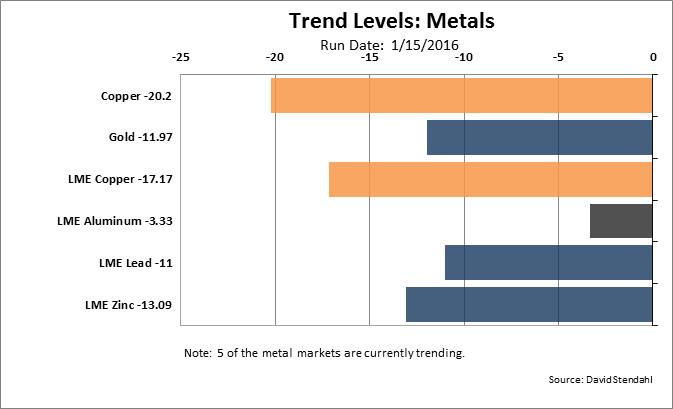
One of the strongest bear markets we are tracking is Copper (HG). Our Trend Level indicator has a reading of -20.2, which is extremely bearish (see Chart 1 below). Fact is, Copper has been in a bear market since 2011. During that time there have been numerous moves to the upside, but each time the bear trend is re-established and it moves lower.
Copper is once again showing short-term signs of making a pivot low and possible establishing a new surge to the upside. When we see the Trend Level move to such an extreme level, there is sometimes a backlash in the market allowing for short-term bullish trading opportunities.
Are we calling for a major low in Copper? Not yet … we simple think Copper has moved to far and to fast.
Chart 1: Trend Level for the Metal Markets
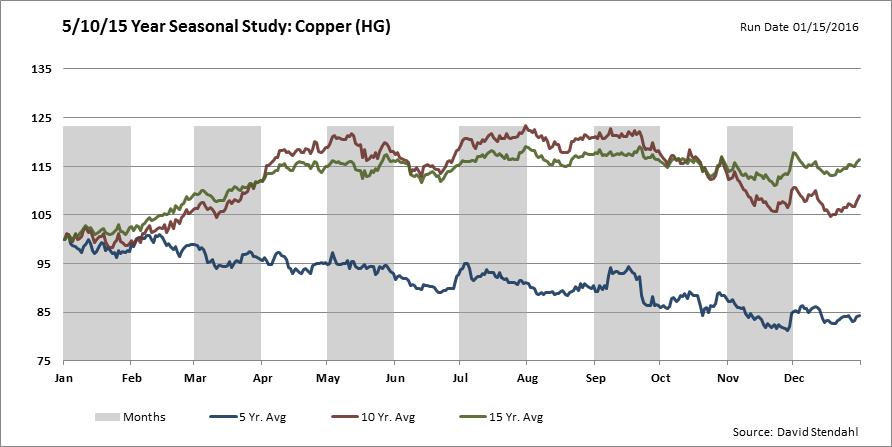
Although this bear phase is still underway, Copper is moving into a seasonal strong period. In the last five years we have not seen a bullish phase emerge. If however we look further back at the ten and fifteen year seasonal trends, we see a very different picture (see Chart 2 below). Based on these longer-term studies, Copper is poised to bottom in January and head higher into March and gain into May.
Chart 2: Copper Seasonal study based on 5/10/15 year analysis
At this point … it’s best to trade with cation and with protective stops.
Monitor our signals as we track Copper over the near term. Copper Signals