Year-to-Date Perspective: LME Copper
When you look at year-end numbers, you don’t always gain a broader perspective on how the market has performed over time. These charts provide you with insight into how LME Copper is currently performing measured against 30 years of year-to-date data. This type of perspective can inform your decision-making on trades and provide you with a more well-rounded view of overall LME Copper performance.
Take a closer look at these four LME Copper charts for a full perspective
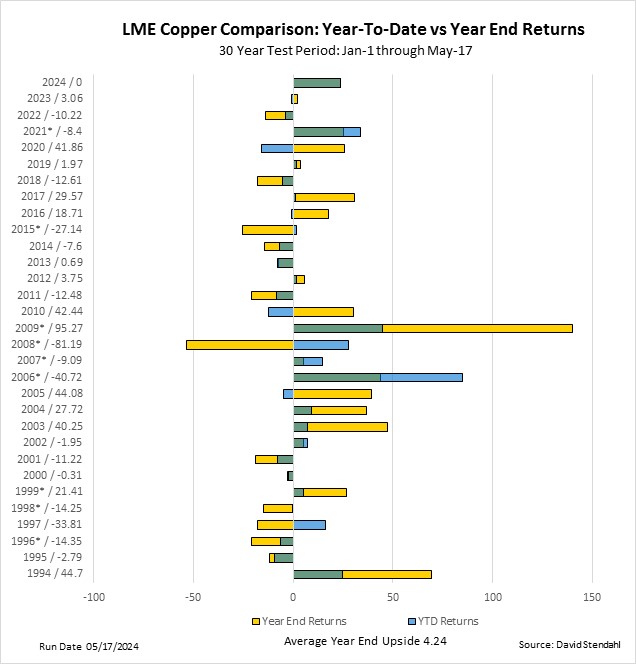
- YTD COMPARISON: Compares year-to-date vs year-end performance
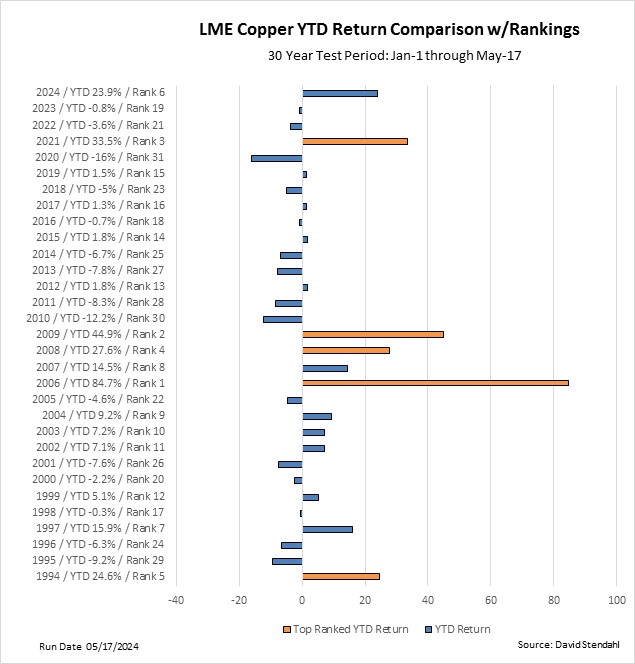
- ANNUAL PERSPECTIVE: Ranks year-to-date performance over the years
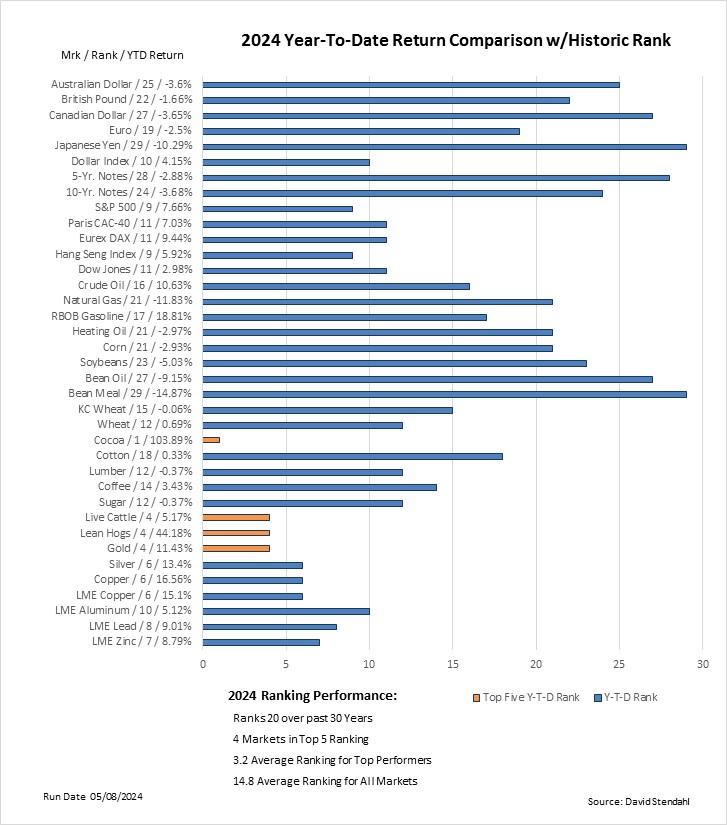
- MARKET PERSPECTIVE: Ranks year-to-date performance across 30+ global futures markets
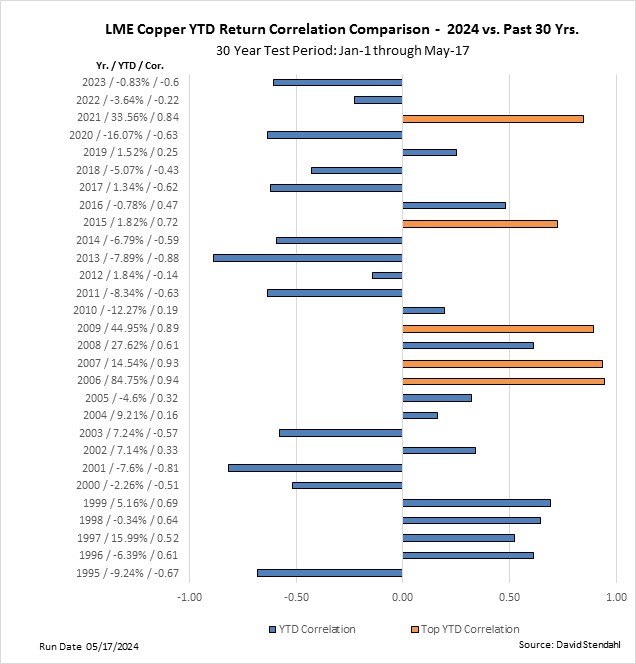
- CORRELATION COMPARISON: Year-to-date correlation study compares current year vs 30 years of past performance
Does the market have upside or downside potential heading into the end of the year? Use this chart to compare year-to-date performance (blue) to year-end performance (yellow). Note that data streams overlap appear green. Only on December 31st will the YTD and year-end data match. Until then, you can see historically where the current YTD performance lies relative to the year-end performance across 30 years of data.

Alongside the year for each bar is a number that shows the surplus or shortage in percentage points between the YTD performance and the year-end performance. At the bottom of the chart, you can find the average surplus or shortage across all 30 years. This chart also highlights each year that has a strong YTD correlation against the current year with an asterisk. See the Correlation Comparison chart for more detail.
Positive YTD Performance:
- ↑ Green Bar with Yellow Tip (YTD < EOY) = Performance upside by year-end. Note the percentage basis surplus next to the date.
- ↓ Green Bar with Blue Tip (YTD > EOY) = Performance downside by year-end. Note the percentage basis shortage next to the date.
Negative YTD Performance:
- ↑ Green Bar with Blue Tip (YTD < EOY) = Performance upside by year-end. Note the percentage basis surplus next to the date.
- ↓ Green Bar with Yellow Tip (YTD > EOY) = Performance downside by year-end. Note the percentage basis shortage next to the date.
How does the current year’s performance compare against other years over the exact same time period? This chart provides a true apples-to-apples performance ranking based on today’s date. The YTD performance ranking will adjust, each day across the year, providing insights into the strength or weakness associated with the current year relative to years past.

Annual ranking for each year based on its year-to-date performance. Markets highlighted in orange indicate ranks 1 – 5.
MARKET PERSPECTIVE:
How strong is the current year and which markets are driving the year-to-date performance? This chart compares each market’s historic ranking based on year-to-date performance across 30+ global futures markets. The summary at the bottom of the chart provides a detailed annual ranking for the year, relative to the past 30 years. For a full breakdown check out our annual YTD Market Comparison.

Markets currently experiencing a top-five YTD performance are highlighted in orange.
How is the current year tracking against previous years on a year-to-date basis? The chart below plots the current correlation between YTD price data for the current year vs previous years. The higher the number the greater the current correlation. Years highlighted in orange offer the best perspective on the potential year-end outcome. See the YTD Comparison chart for more detail.

Markets highlighted in orange correspond to the top five correlation YTD periods with the current year. The left legend shows the calendar year, YTD performance and the correlation based on price data.
How does this year compare with history?
All trading involves risk. Leveraged trading has large potential rewards, but also large potential risk. You must be aware of the risks and be willing to accept them in order to invest in the futures and options markets. Don’t trade with money you can’t afford to lose. This is neither a solicitation nor an offer to Buy/Sell futures or options. No representation is being made that any account will or is likely to achieve profits or losses similar to those discussed. The past performance of any trading system or methodology is not necessarily indicative of future results.
Our strategies have not been developed based on knowledge of or with reference to your particular circumstances, such as financial position, goals, risk-reward preferences, tax situation, brokerage arrangement, investment or trading experience, and so forth. Hence no content or model published here constitutes a recommendation that any particular security, portfolio of securities, transaction, or investment strategy is suitable for any specific person. You alone are solely responsible for determining whether any investment, security or strategy, or any other product or service, is appropriate or suitable for you based on your investment objectives and personal financial situation. More
