MAR Comparison:
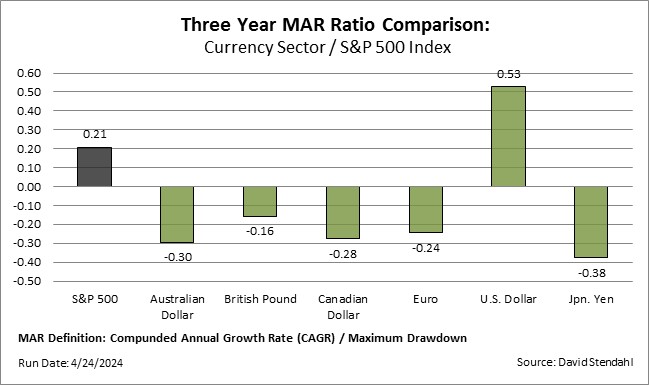
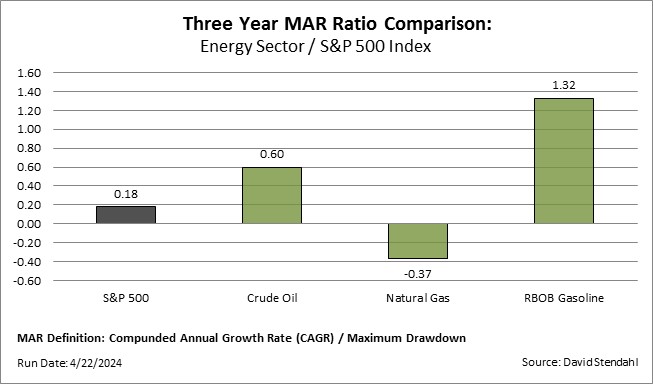
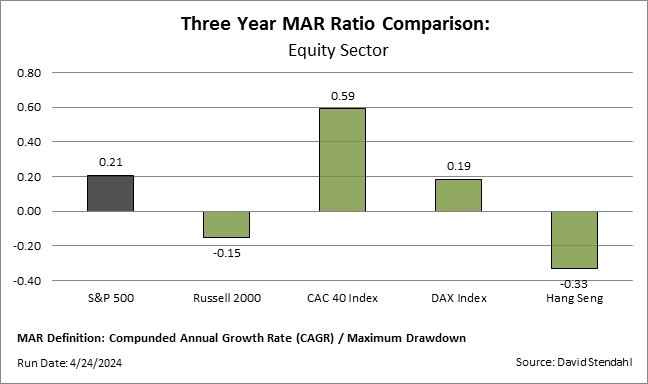
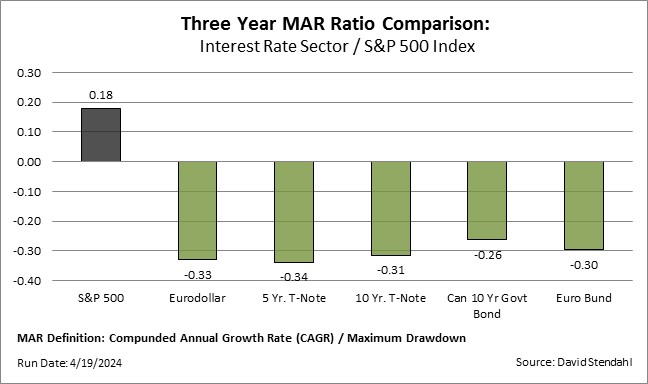
The MAR (Minimum Acceptable Return) ratio is a risk reward ratio that focuses on annual growth and maximum drawdown for a test period. MAR, sometimes referred to as calmar, has its flaws as a risk reward metric. One major drawback is its heavy dependence on a single worst-case drawdown situation as its measurement of risk. With that said MAR does have a basic advantage … it allows for easy side-by-side comparison of markets.
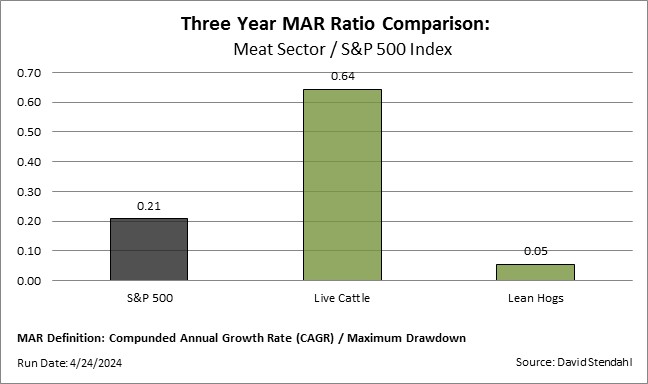
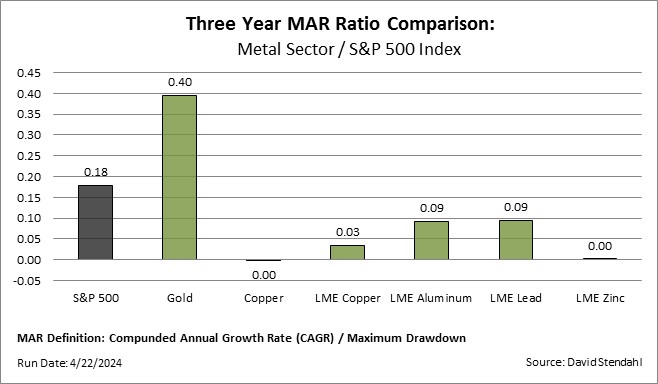
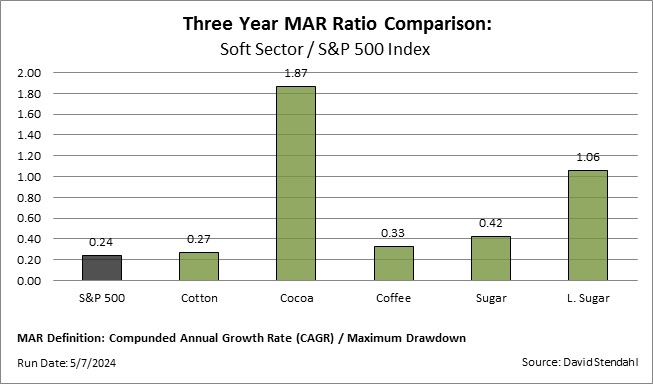
The study below compares each market within a sector alongside the S&P 500 Index, with the key being higher MAR ratios offering more attractive historic risk/reward performance. Investors that ONLY focus on returns to judge market performance fail to realize the inherent risks associated with a market. A quick look at the MAR comparison chart below should provide some much needed clarity.
Definitions:
- MAR ratio divides Compounded Annual Growth Rate (CAGR) by Maximum Drawdown.
- Calmar ratio is exactly the same as MAR but it limits itself to a 36 month look back period.
- Compounded Annual Growth Rate (CAGR) measures the growth of an investment as if it had grown at a steady rate on an annually compounded basis.
- Maximum Drawdown measures the largest peak-to-valley loss based on monthly return data.
Sector Breakdown based on MAR:

