Equity High Comparison:
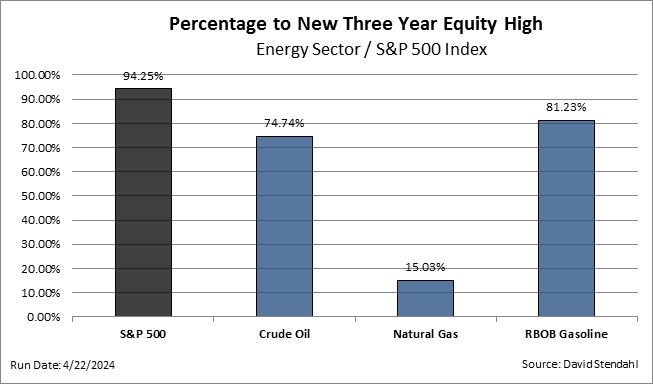
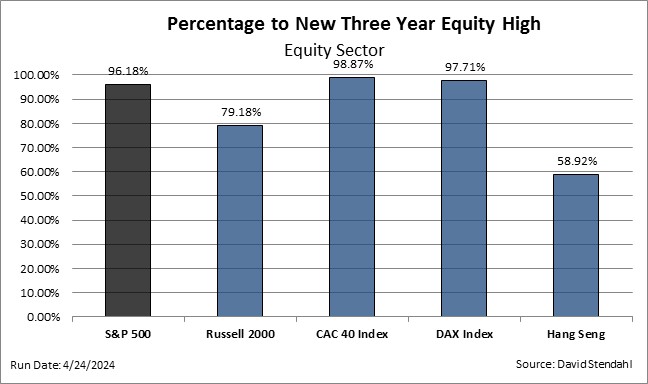
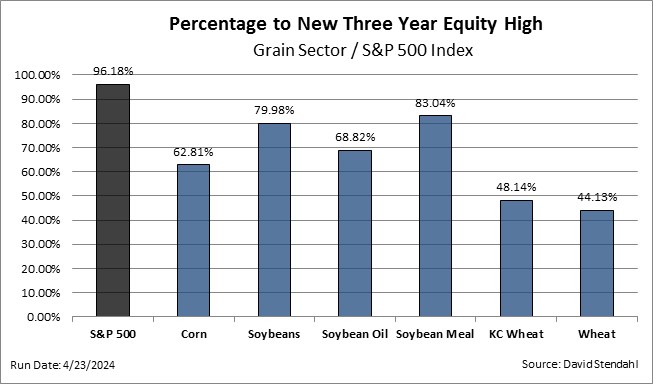
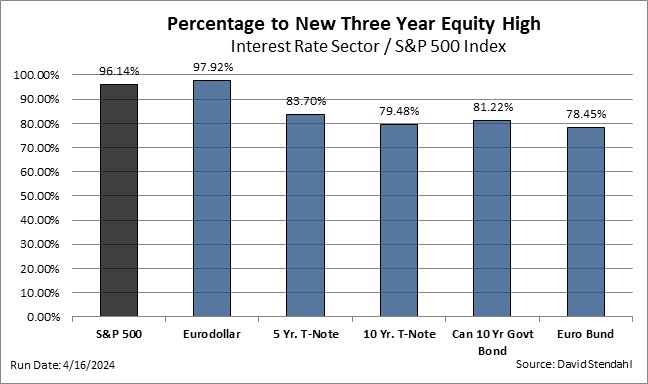
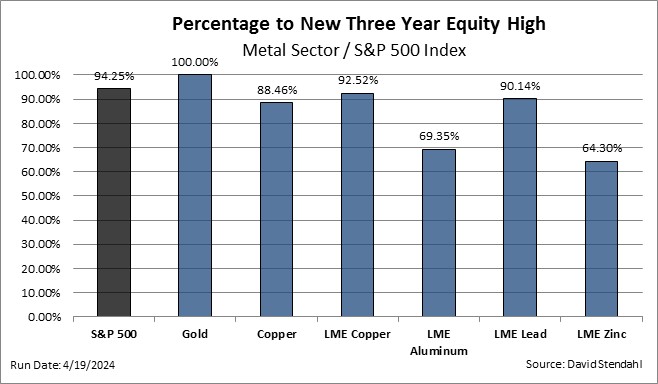
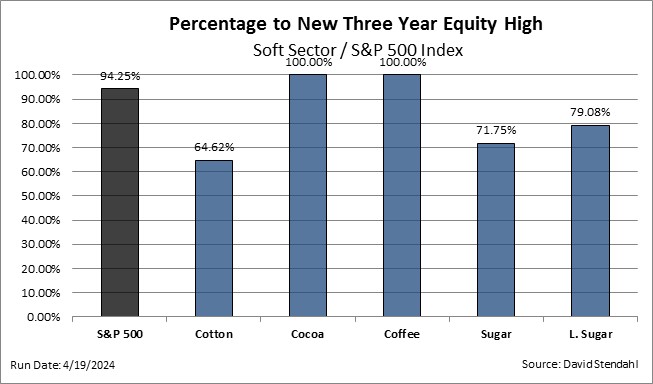
Hitting a new 52 week high gets a market in the newspaper … but establishing a new three year (156 week) equity high validates the true strength of a markets trend. The chart below compares each of the markets against the S&P 500 index. If a market is shown to be at 100%, then its currently at a new three year equity high. If not, then the percentage number indicates how close it is to a new equity high. For more detail visit our Underwater Volume Index (UVI) area to see historic equity high watermark charts for each market we track.
Sector Breakdown based on Three Year Equity High: