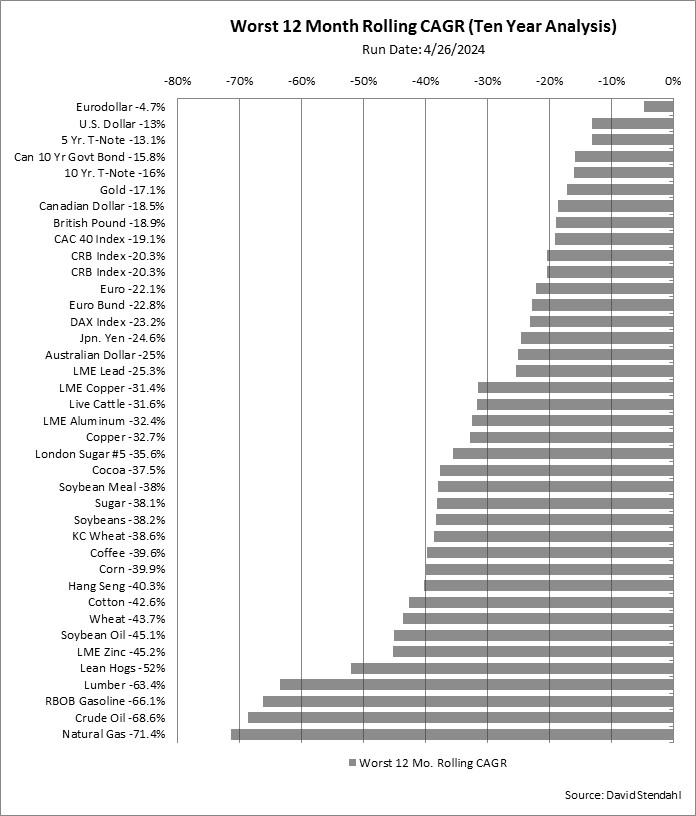
Rolling CAGR Overview
12 Month Compounded Annual Growth Rate (CAGR) Comparison
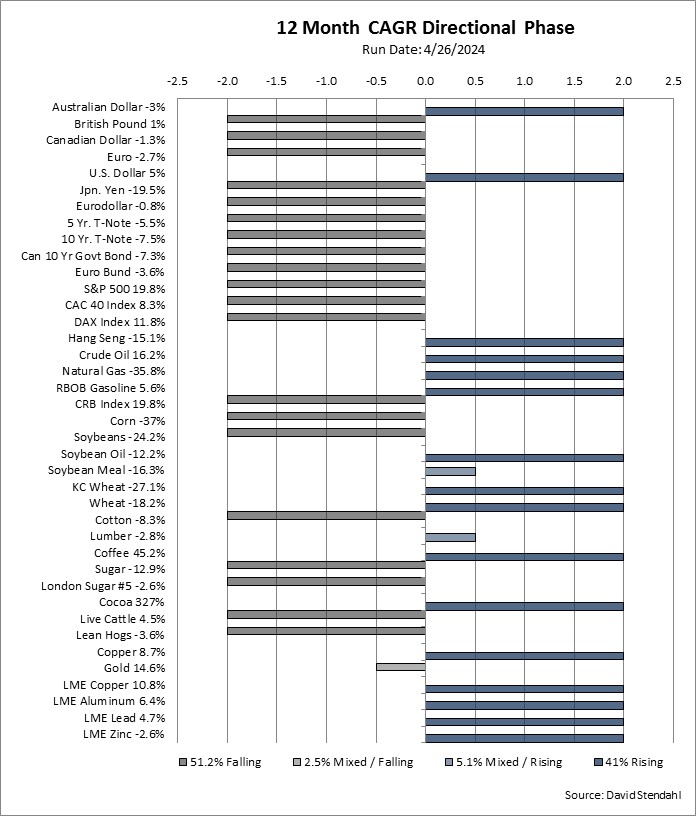
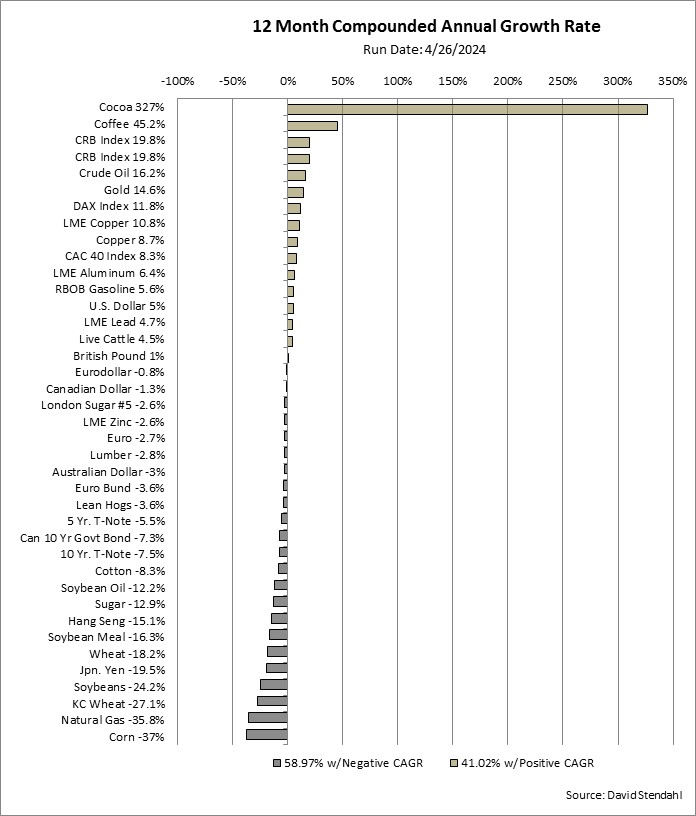
A markets best 12 month Compounded Annual Growth Rate (CAGR) over ten years can’t tell you when to buy or sell a market. Bottom line … it can’t be used for trading. It can however, be used to provide perspective on a markets past performance. Here is how it’s calculated. Over a ten year period there are 120 separate monthly data points. Each data point looks at the previous 12 months and calculates a CAGR for that specific look back period. All 120, 12 month CAGR’s, are then sorted based on the best Rolling 12 Month Compounded Annual Growth Rate for each market.
Best Rolling 12 Month Compounded Annual Growth Rate Comparison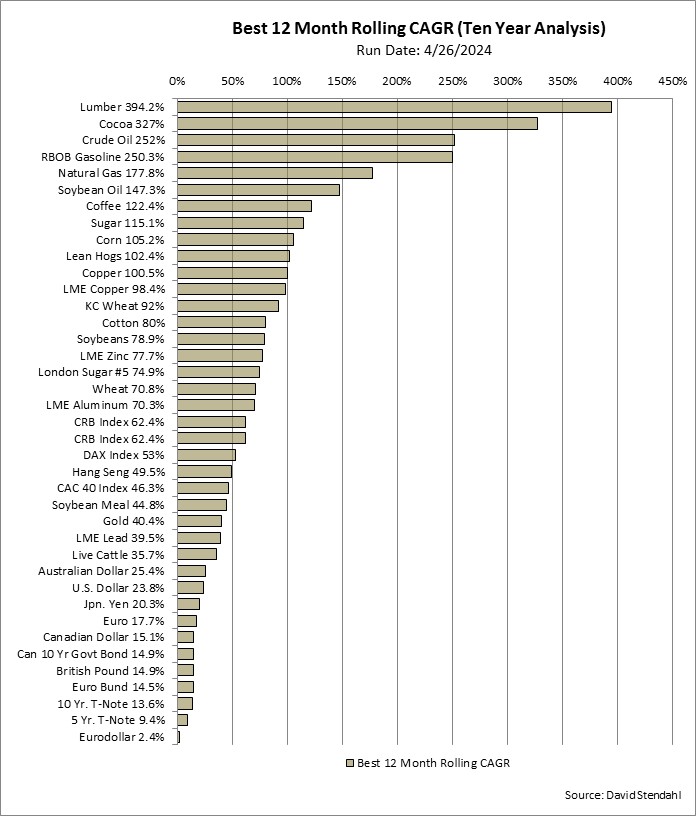
A markets average 12 month Compounded Annual Growth Rate (CAGR) over ten years can’t tell you when to buy or sell a market. Bottom line … it can’t be used for trading. It can however, be used to provide perspective on a markets past performance. Here is how it’s calculated. Over a ten year period there are 120 separate monthly data points. Each data point looks at the previous 12 months and calculates a CAGR for that specific look back period. All 120, 12 month CAGR’s, are then averaged creating the markets Average Rolling 12 Month Compounded Annual Growth Rate.
Average Rolling 12 Month Compounded Annual Growth Rate Comparison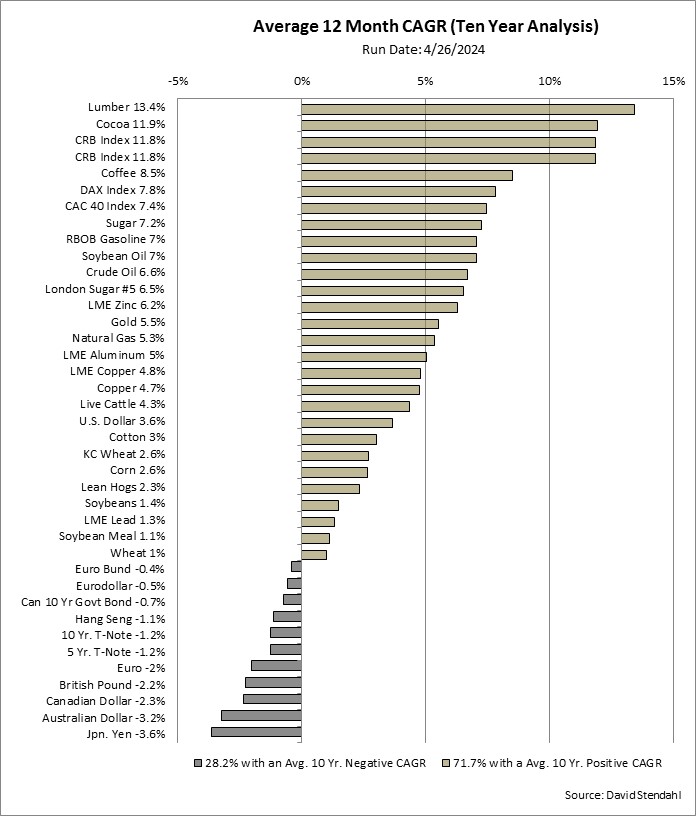
A markets worst 12 month Compounded Annual Growth Rate (CAGR) over ten years can’t tell you when to buy or sell a market. Bottom line … it can’t be used for trading. It can however, be used to provide perspective on a markets past performance. Here is how it’s calculated. Over a ten year period there are 120 separate monthly data points. Each data point looks at the previous 12 months and calculates a CAGR for that specific look back period. All 120, 12 month CAGR’s, are then sorted based on the worst Rolling 12 Month Compounded Annual Growth Rate for each market.
Worst Rolling 12 Month Compounded Annual Growth Rate Comparison