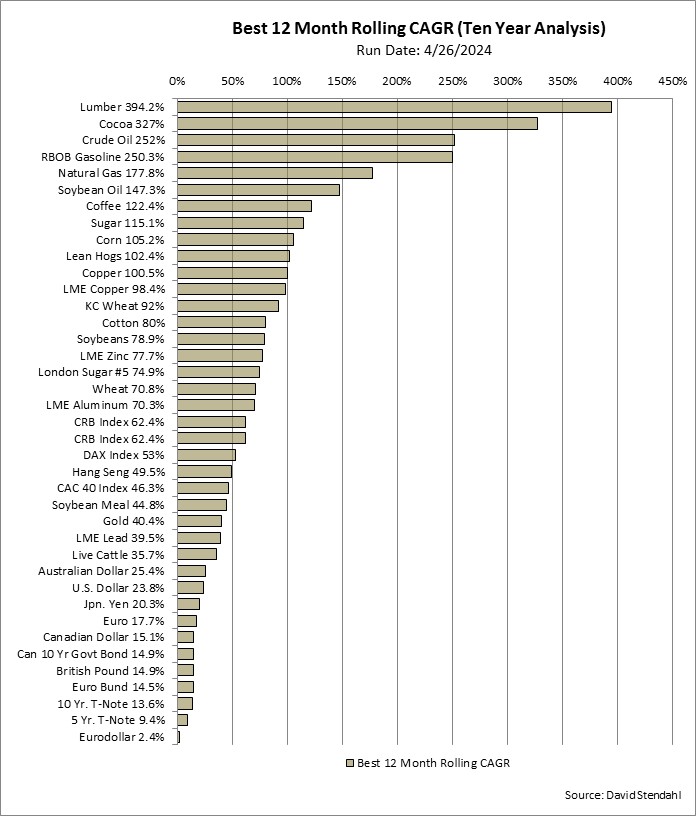
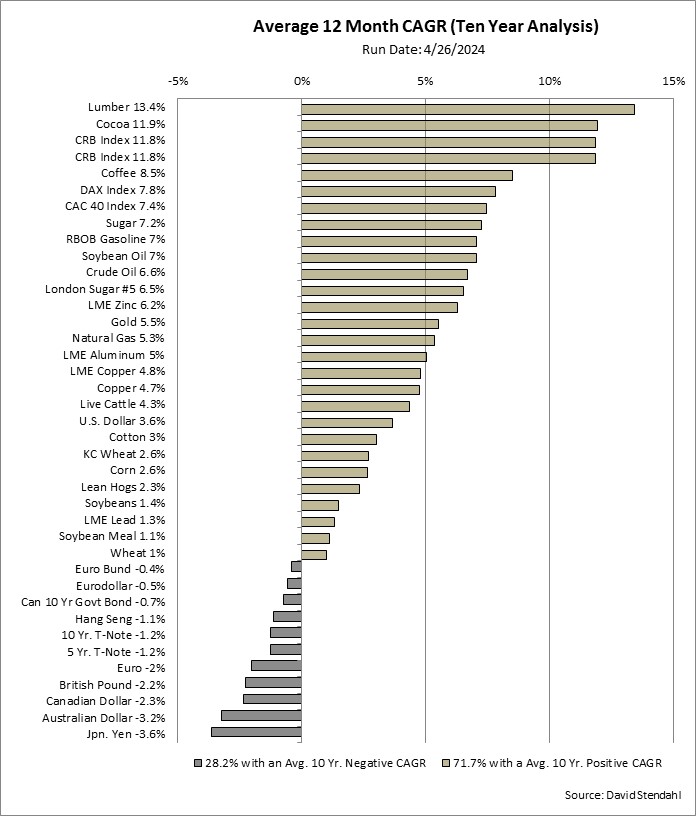
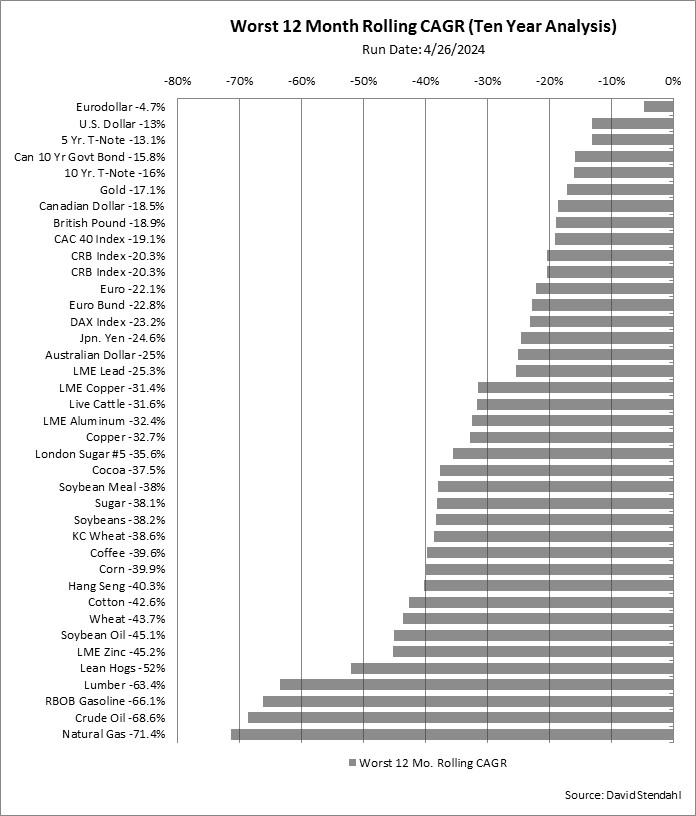
Rolling 12 Month CAGR Overview: Ten Year Analysis
A markets best/average/worst 12 month Compounded Annual Growth Rate (CAGR) over ten years can’t tell you when to buy or sell a market. Bottom line … it can’t be used for trading. It can however, be used to provide perspective on a markets past performance. Here is how it’s calculated. Over a ten year period there are 120 separate monthly data points. Each data point looks at the previous 12 months and calculates a CAGR for that specific look back period. All 120, 12 month CAGR’s, are then sorted based on the best Rolling 12 Month Compounded Annual Growth Rate for each market.