Return Calendar: KC Wheat
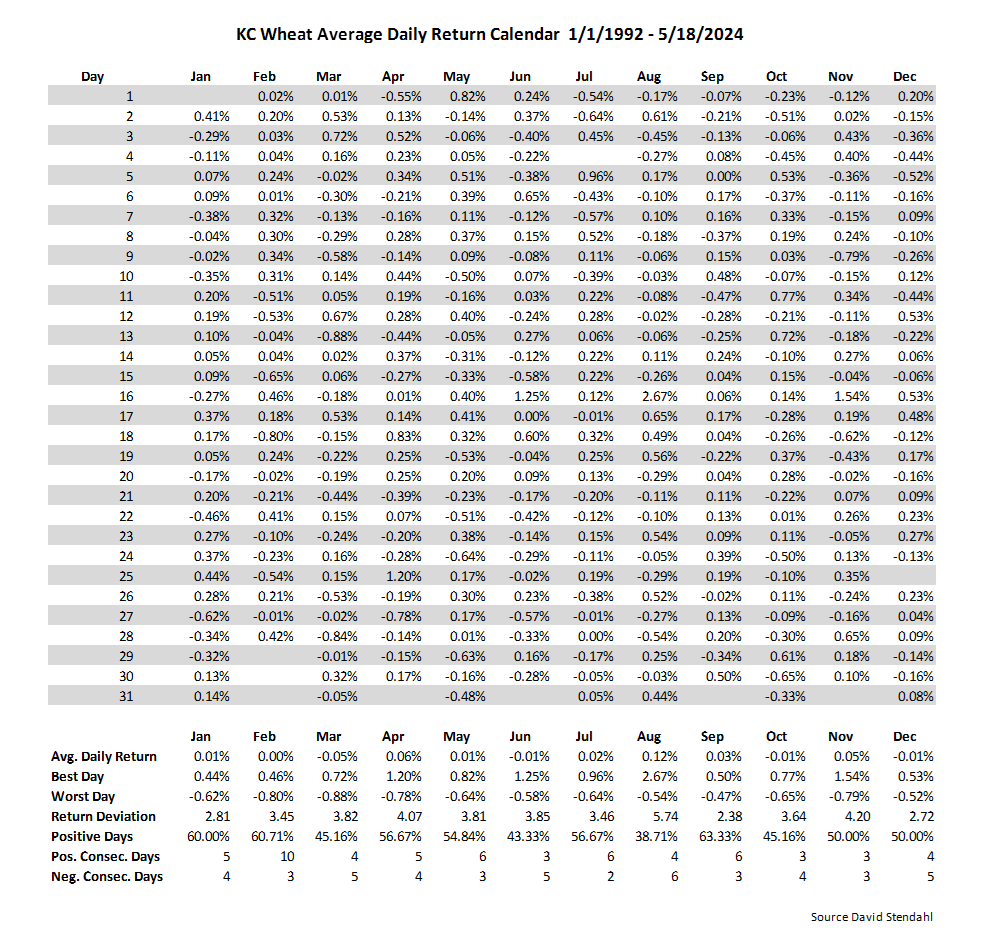
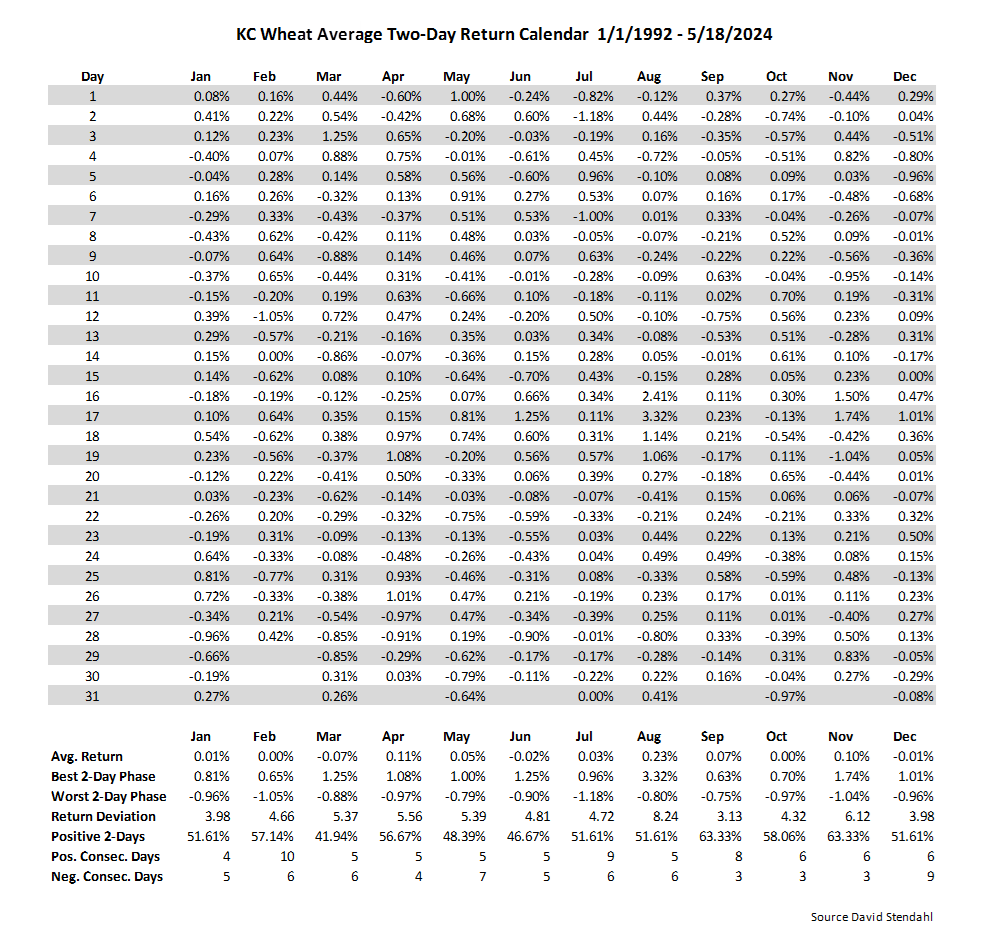
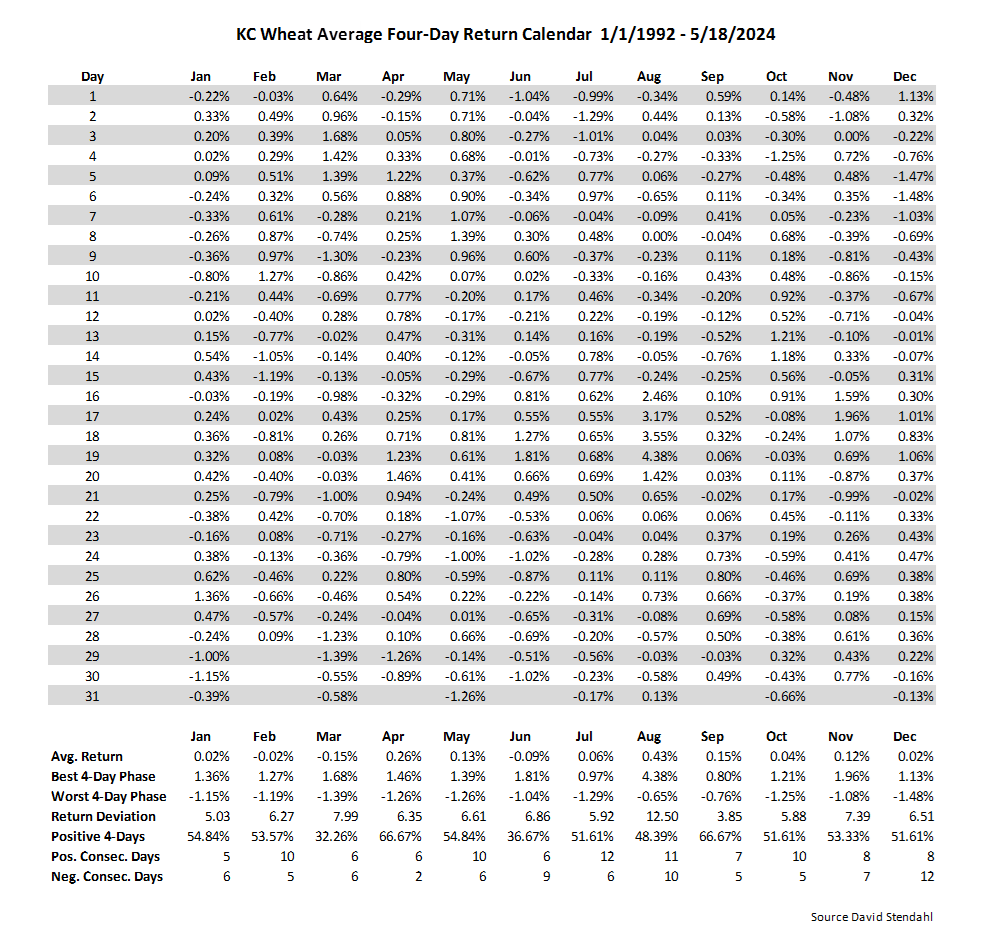
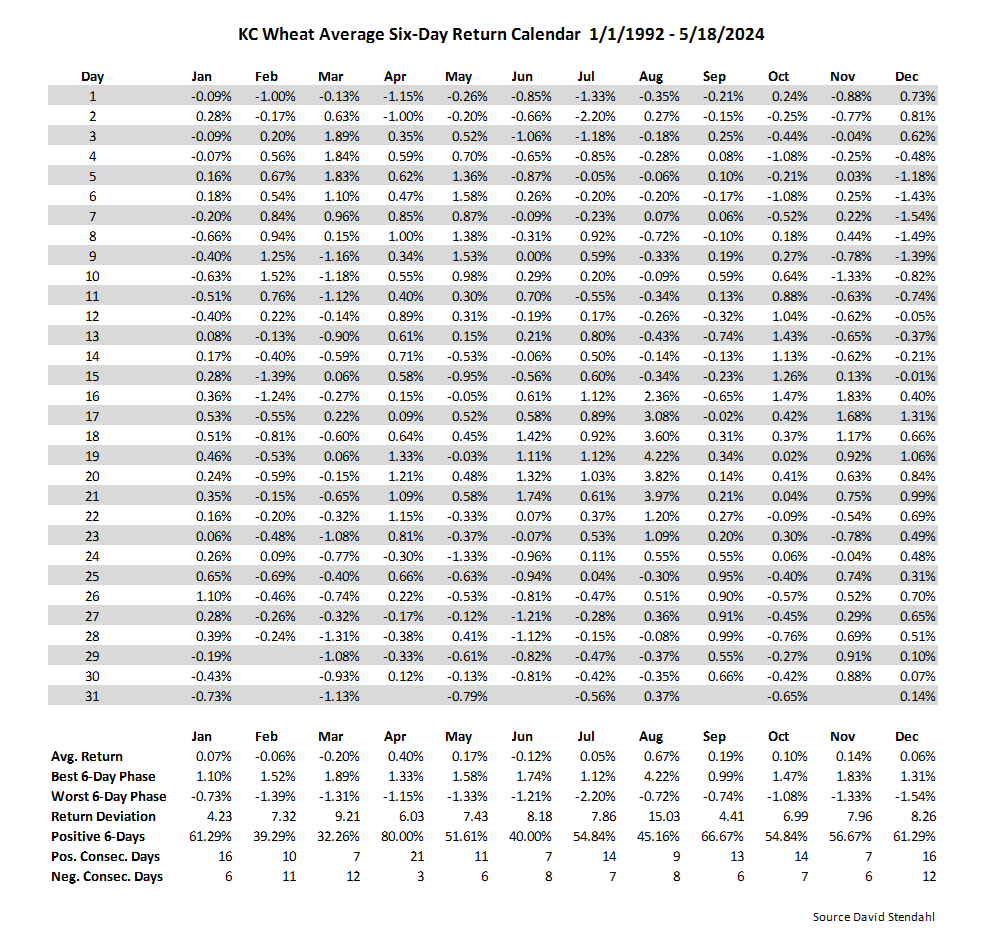
Over the course of a year, every market experiences some degree of seasonal strength or weakness. Our traditional seasonal charts provide a longer-term view of price gyrations throughout the year, but sometimes a quick review of daily returns based on calendar days provides a better shorter-term perspective. With this in mind, we offer four Return Calendars that span different time periods across 30+ years of data. These 1/2/4/6-day return calendars allow for a close inspection of market returns, each fixed on a specific day or date range.
Return Calendar Examples:
- Average market performance the day before Christmas
- Return bias two days before and after the April 15th tax deadline
- Cumulative return based on the first four days of the new year
- Six-day performance return leading up to the end of the second quarter
Each Return Calendar is accessible by clicking on the separate tabs below.

Signals are NOT buy/sell recommendations. Our information is strictly provided for educational purposes only. As always, trade at your own risk and analysis.

Signals are NOT buy/sell recommendations. Our information is strictly provided for educational purposes only. As always, trade at your own risk and analysis.

Signals are NOT buy/sell recommendations. Our information is strictly provided for educational purposes only. As always, trade at your own risk and analysis.

Signals are NOT buy/sell recommendations. Our information is strictly provided for educational purposes only. As always, trade at your own risk and analysis.
Return Calendar Monthly Metrics
Each Return Calendar reviews 30-plus years of positive and negative daily returns. At the bottom of each Return Calendar, there is a monthly breakdown of a few performance metrics. These include:
- Average Return for the series, including the best and worst return phase for the month.
- Return Deviation of the average return – the smaller the number the more consistent the average return.
- Positive days/date range, the higher the number the greater the percent profitable periods over the month.
- Consecutive positive and negative days/date range over the course of the month. Focus on months that offer high consecutive periods of positive or negative return periods.
Calendar Breakdown by Events
All trading involves risk. Leveraged trading has large potential rewards, but also large potential risk. You must be aware of the risks and be willing to accept them in order to invest in the futures and options markets. Don’t trade with money you can’t afford to lose. This is neither a solicitation nor an offer to Buy/Sell futures or options. No representation is being made that any account will or is likely to achieve profits or losses similar to those discussed. The past performance of any trading system or methodology is not necessarily indicative of future results.
Our strategies have not been developed based on knowledge of or with reference to your particular circumstances, such as financial position, goals, risk-reward preferences, tax situation, brokerage arrangement, investment or trading experience, and so forth. Hence no content or model published here constitutes a recommendation that any particular security, portfolio of securities, transaction, or investment strategy is suitable for any specific person. You alone are solely responsible for determining whether any investment, security or strategy, or any other product or service, is appropriate or suitable for you based on your investment objectives and personal financial situation. More
