Market Forecast: Coffee
What is the market forecast chart? This chart uses price action periods to simulate current conditions in Coffee. To do this, this chart examines the same 45-day timeframe across time, scanning the last 30 years to identify any periods with strong correlations with current conditions. Typically, one to five historic time periods will closely align with the price action in the current year.
Next, the historic time periods are normalized, weighted, and combined to form an index for the underlying market. Extrapolating the historic performance of this index thirty days out provides a forecast for potential price moves for the market.
While this forecast is not intended to generate specific buy-sell recommendations, it does identify possible key reversal points and/or extended trends.
Coffee 30-Day Market Forecast
Signals are NOT buy/sell recommendations. Our information is strictly provided for educational purposes only. As always, trade at your own risk and analysis.
Market Forecast Chart Explained:
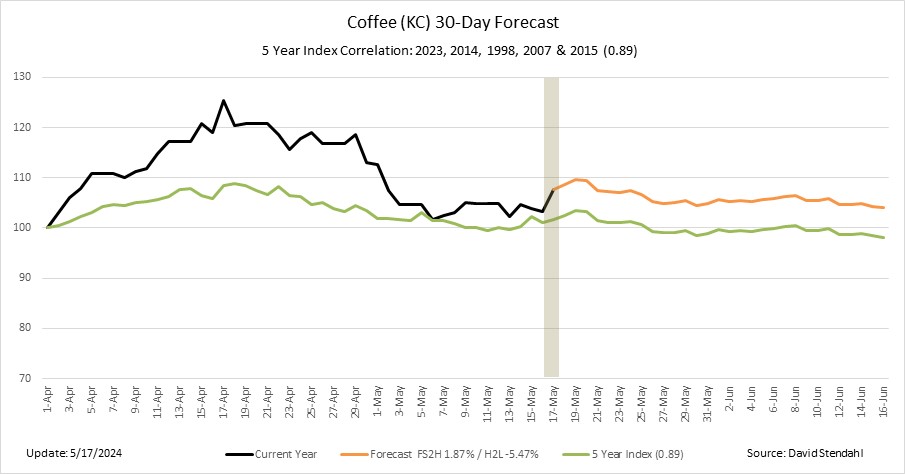
- GREEN LINE: This represents an index of historic data that closely tracks the current underlying market, consisting of two phases both using the same green line but separated by the vertical tan area. Phase one (shown left) shows the 45-days of highly-correlated index data with current conditions. Phase two (shown right) shows the 30-day forecast based on the historic performance of the index.
- TAN VERTICAL LINE: This identifies the run date for the chart and distinguishes between historic and forecast data.
- BLACK LINE: This shows the current price data over the past 45-day.
- ORANGE LINE: This represents the extension of the 30-day forecast normalized to the current price data. Note: The orange forecast line will mirror the extension of the green index line. They both reference the same data with the only difference being their starting point.
Looking for a longer term outlook?
All trading involves risk. Leveraged trading has large potential rewards, but also large potential risk. You must be aware of the risks and be willing to accept them in order to invest in the futures and options markets. Don’t trade with money you can’t afford to lose. This is neither a solicitation nor an offer to Buy/Sell futures or options. No representation is being made that any account will or is likely to achieve profits or losses similar to those discussed. The past performance of any trading system or methodology is not necessarily indicative of future results.
Our strategies have not been developed based on knowledge of or with reference to your particular circumstances, such as financial position, goals, risk-reward preferences, tax situation, brokerage arrangement, investment or trading experience, and so forth. Hence no content or model published here constitutes a recommendation that any particular security, portfolio of securities, transaction, or investment strategy is suitable for any specific person. You alone are solely responsible for determining whether any investment, security or strategy, or any other product or service, is appropriate or suitable for you based on your investment objectives and personal financial situation. More