Stay in the know with signal updates throughout the day.
Signal Updates - Intraday
Signals are updated generally every 15 minutes from Sunday’s open until Friday’s close.
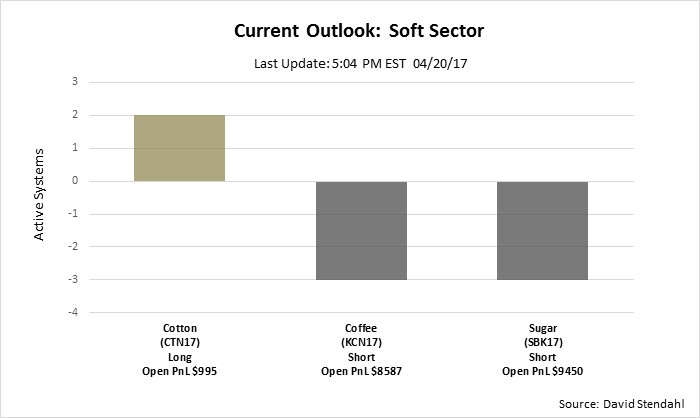
- Net Signal – Lists all open positions across different time horizons and trading styles into a single net Long/Short overview.
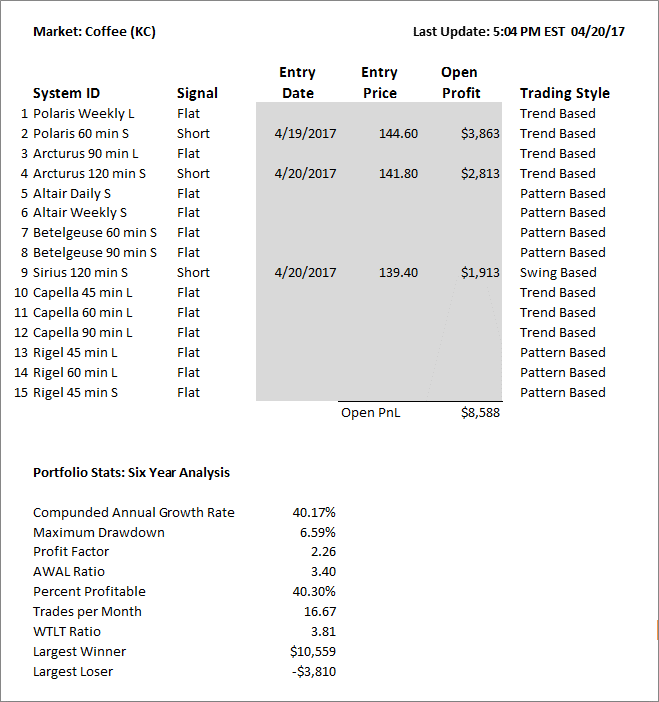
- Detailed Signal – Lists signals with greater clarity providing Entry, Exit, Date, Price, Time Horizon and Trading Style details.
- Exit Signals – Lists signals that have recently exited positions over the past two trading days.
Activity/Performance - Intraday
Trade activity, performance metrics and signal breakdowns are updated generally every 15 minutes during market hours Sunday – Friday.
- Trade Activity – Recent Signals & Trades by the Hour
- Performance Metrics – Open Profit Loss & Open Profit Allocation
- Signal Breakdown – System Leverage, Directional Bias & Signal Allocation
Social Media - Intraday
The easiest ways to draw attention to our market analysis is to post to our social media sites – day and night. The vast majority of our posts will come with a direct link to the related analysis.
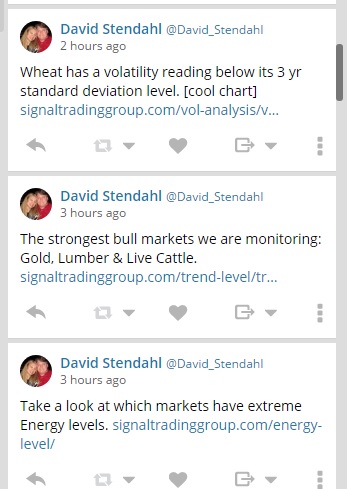
- Open Twitter Account – We post general market observations early morning to mid afternoon and then again in the evening.
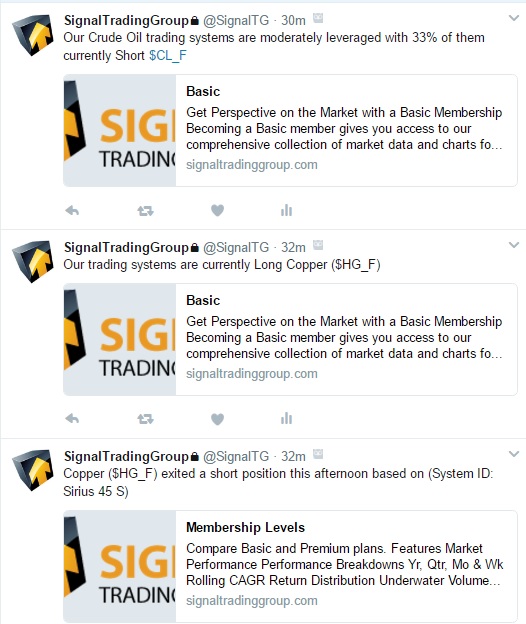
- Private Twitter Account – We post signal related comments providing updates to all the systems through out the day and evening.
- StockTwits – We post systems allocation updates generally mid morning and early afternoon.
Market Context - Daily
On a nightly bases we generate 2500 charts that provide context around the markets. The nightly process takes 3+ hours to complete and is typically available by 10:30 PM EST.
- Market Performance – Market Returns, Distribution & Rolling CAGR
Market Environment – Trend Level, Energy Level & Elastic Level - Seasonal Charts – Opportunity, Turning Points, Depth, Accuracy & Projections
- Price Targets/Watch List – Support Resistance Levels & various watch lists that focus on markets with a true directional bias
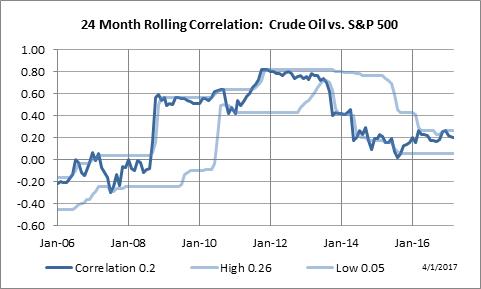
Correlation Studies - Weekly
Our correlation studies focus on 40 global futures markets generating a total of 3200 rolling weekly/monthly charts. All of the correlation studies are updated on an end-of-week basis.
- Dynamic Correlation – Weekly and monthly rolling correlation studies
- Directional Comparison – Compares the directional moves of various markets against the S&P 500
Exit Signals
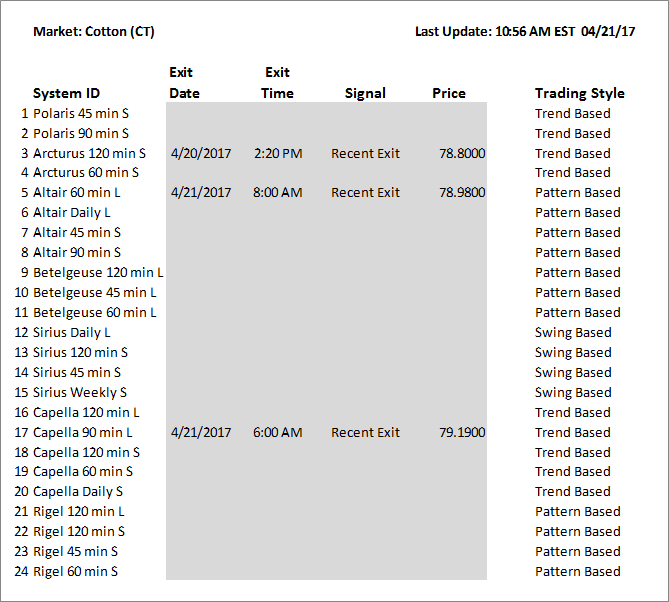
Signals provided for educational purposes only. Trade at your own risk and analysis.
Detailed Signals
The Detailed page highlights new and existing signals along with basic portfolio performance metrics for the market. [Premium Subscription: Updated Sunday – Friday]
Signals provided for educational purposes only. Trade at your own risk and analysis.
Net Signal
The Net Signal page provides an overview whether the systems are net long or short, flat or hedged. [Basic Subscription: Updates Sunday – Friday]
Signals provided for educational purposes only. Trade at your own risk and analysis.
System Breakdown
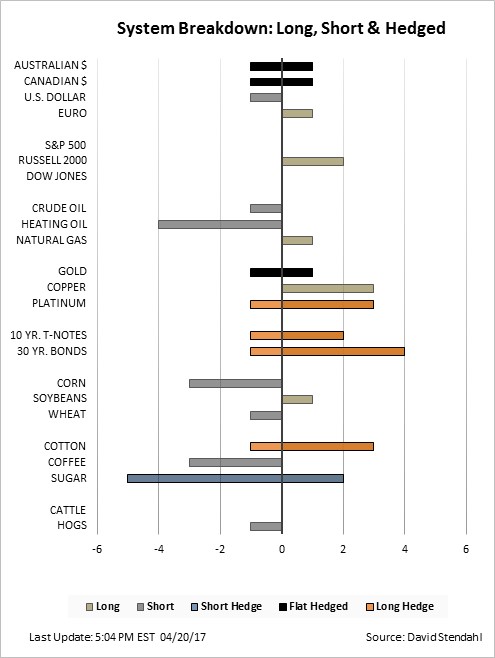
The System Breakdown page makes it easy to quickly review how aggressive or conservative our allocation is in any market. [Premium Subscription: Updates Sunday – Friday]
Performance Metrics
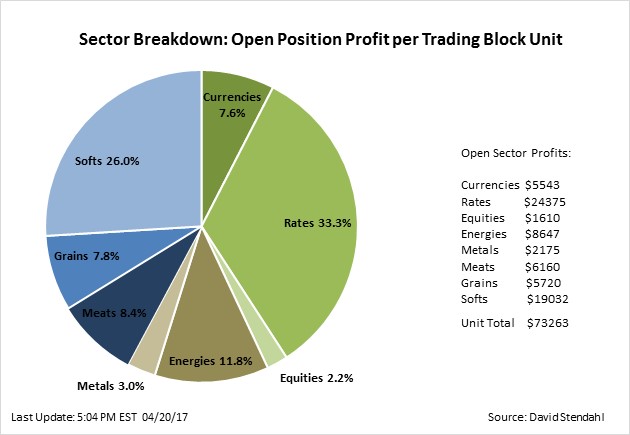
We offer a number of charts that provide performance metrics for each market and the entire portfolio. [Premium Subscription: Updates Sunday – Friday]
Trade Activity
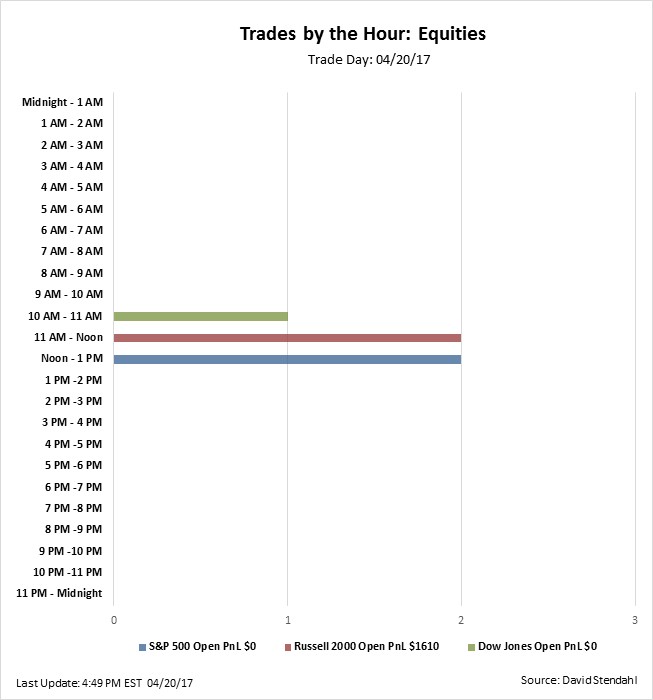
You will never miss a signal as the Trade Activity chart make it easy to know when signals were generated over a 24 hour trading day. [Basic Subscription: Updates Sunday – Friday]
StockTwits
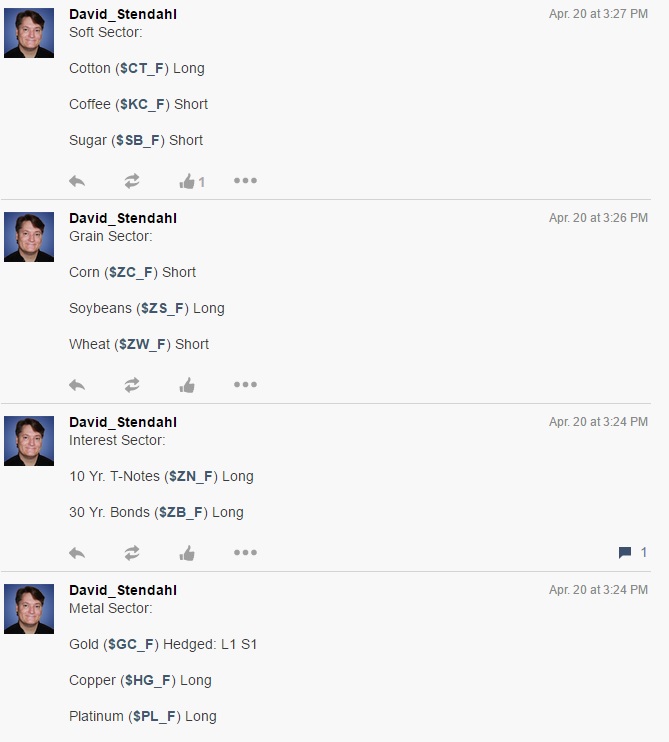
You can follow us on StockTwits @ David_Stendahl
Private Twitter Account
You can follow our Private Twitter feed by signing up on our site. Simple go to the Main menu – Signals – Twitter Signals.
Open Twitter Account
You can follow our general market commentary on twitter @ David_Stendahl
Price Targets
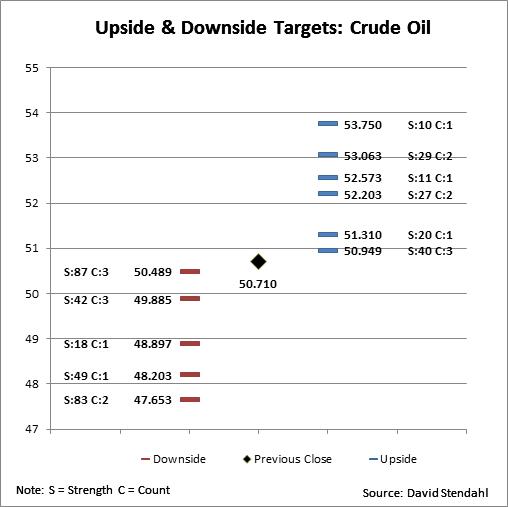
The Price Target page provides support resistance levels for each market complete with count and strength metrics. [Premium Subscription: Updated daily]
Seasonal Charts
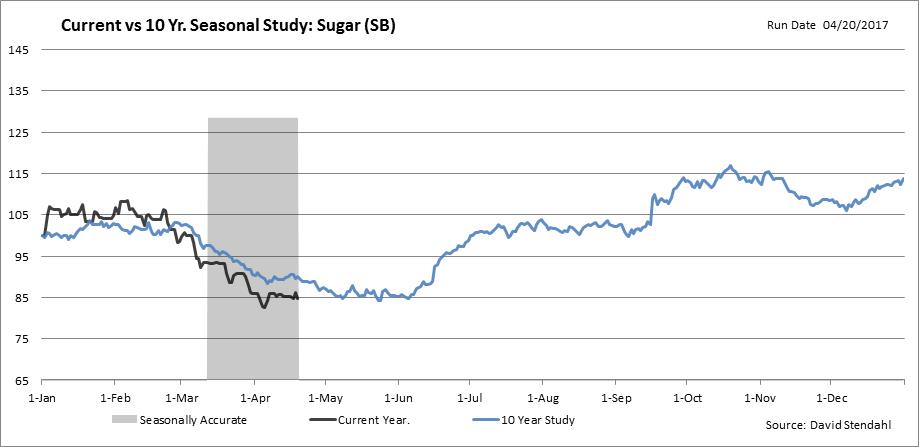
The 450 Seasonal Charts generated on a nightly basis provide a step-by-step process to analyze markets that are accurately tracking past seasonal trends. [Plus Subscription: Updated daily]
Market Environment
The Market Environment charts define the state of the markets by focusing on periods of consolidation/expansion, bull/bear trends and overbought/oversold phases. [Basic Subscription: Updated daily]
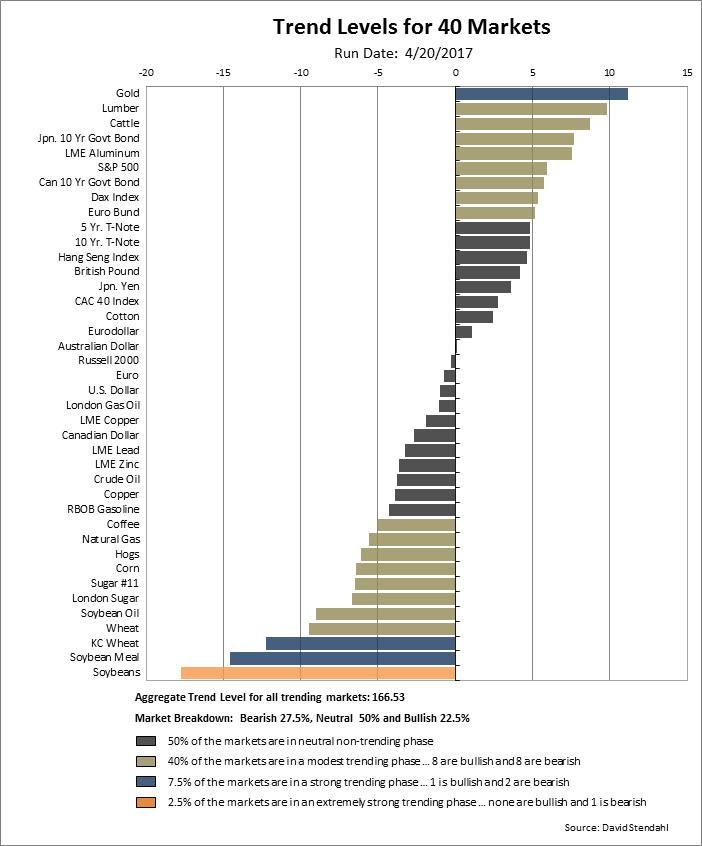
Market Performance
The Market Performance charts rank 40 global futures markets providing perspective on markets users may have an interest in trading. [Basic Subscription: Updated Daily]
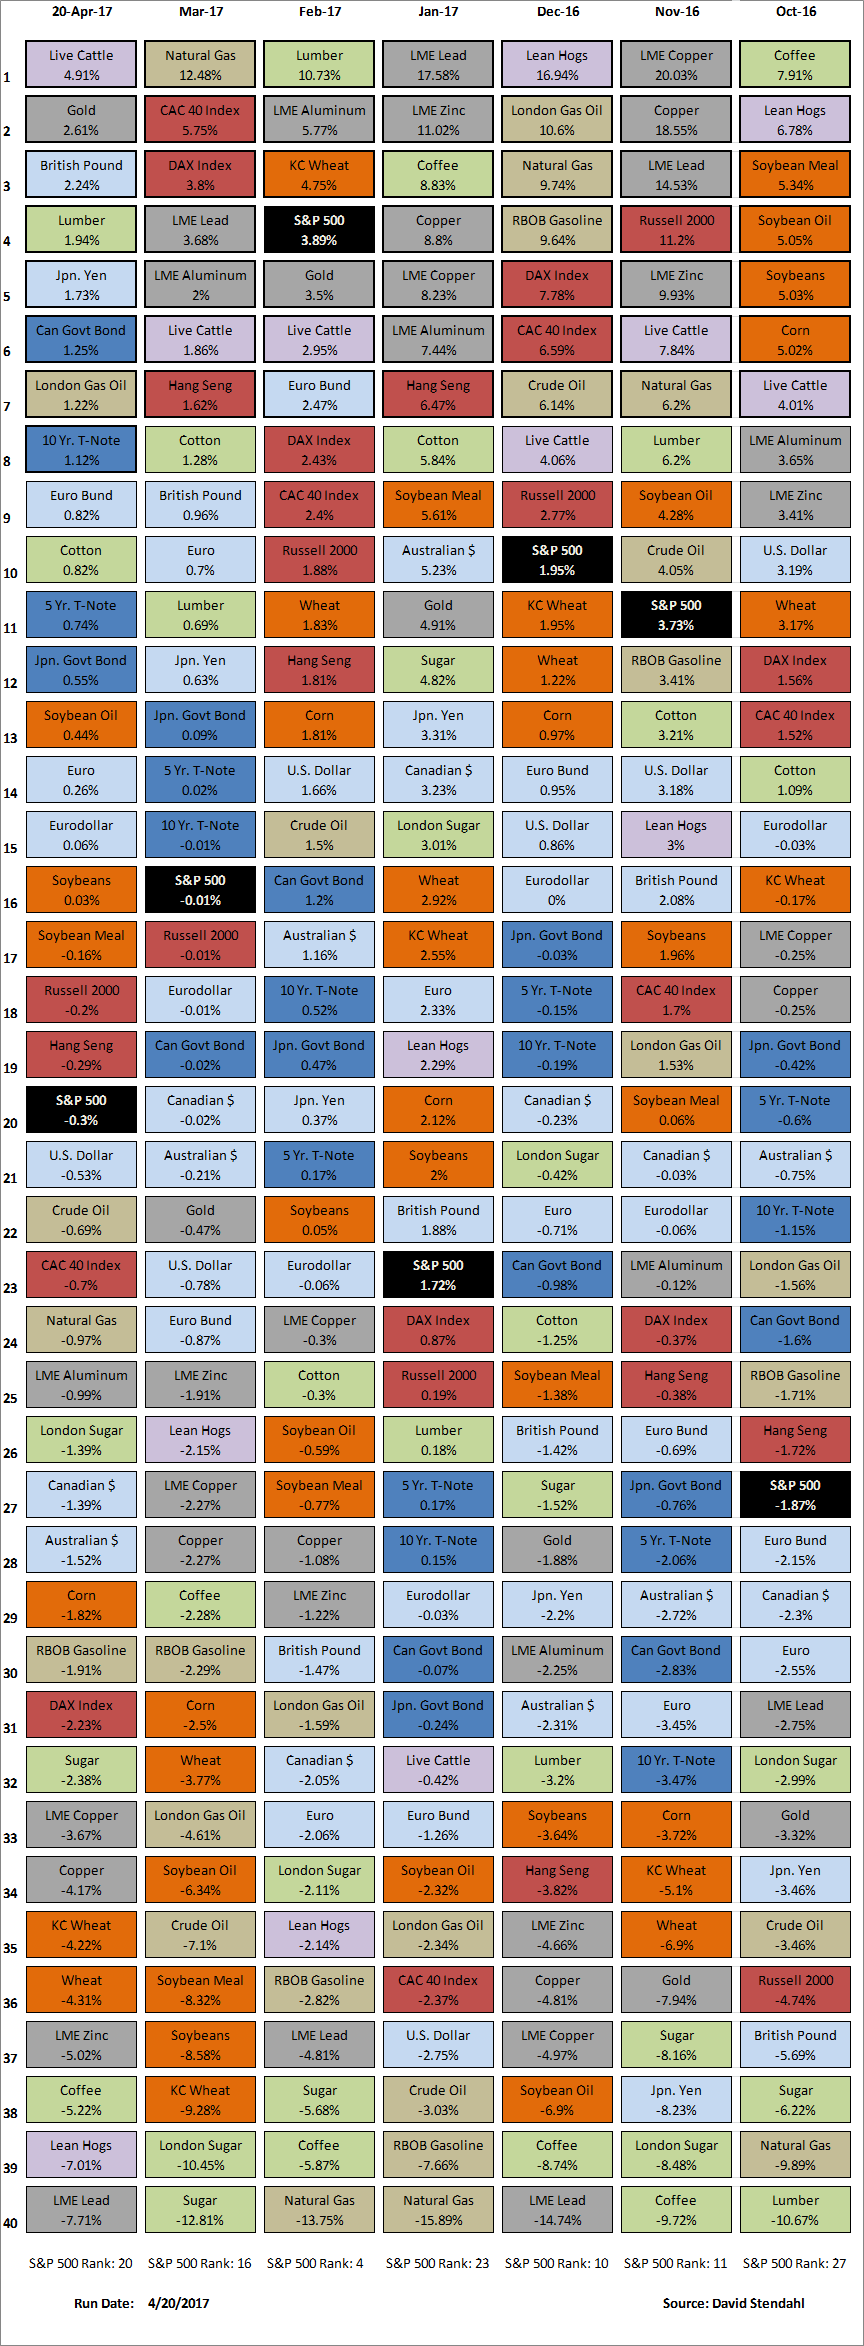
Directional Comparison
The Direction Comparison charts provide insight into time/return relationships between various global futures markets and the S&P 500 index. [Basic Subscription: Updated Weekly]
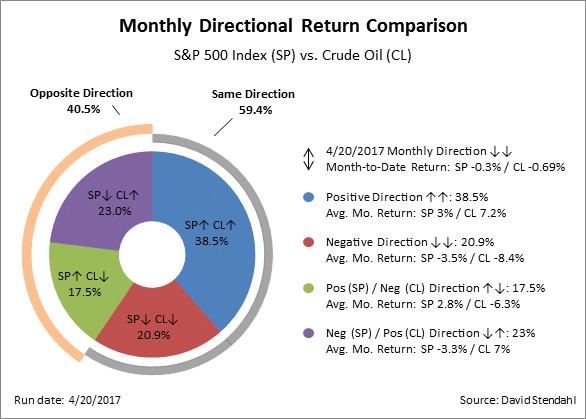
Dynamic Correlation
The Rolling Correlation studies provide a 24 week/month historic perspective on the relationship between various futures markets. The dynamic upper & lower boundaries makes it easy to know if relationships are in a high or low correlation environment. [Basic Subscription: Updated Weekly]
