Event: Fibonacci Ratio Day (AKA The Golden Ratio)
Fibonacci Ratio day is celebrated on June 18th because it matches the famous ratio of .618. Let’s begin with an explanation of the Fibonacci Ratio. Fibonacci numbers form a sequence where a number is the sum total of the last two numbers, starting with 0, 1, 1, 2, 3, 5, 8, 13, 21, 34, 55 … and so forth. When we take any two successive Fibonacci numbers, their ratio is very close to 1.618, or its inverse 0.618. This .618 ratio goes by two other names called the “Golden Ratio”. The golden ratio can be seen in nature in flower petals, sunflower seed heads, tree branches, nautilus shells, spiral galaxies, hurricanes, human faces, animal bodies, and DNA molecules. Basically, it’s all around us … so many believe the golden ratio can be used in trading to help find support or resistance levels.
Fibonacci retracements use horizontal lines to indicate areas of support or resistance. Levels are calculated using the high and low points on a chart. Three levels will emerge from these chart extremes at 38.2%, 50%, and 61.8%. After a significant price movement up or down, the new support and resistance levels are often at or near these levels.
The questions is … are the markets positively or negatively influenced leading up to Fibonacci Ratio day?
Market Comparision
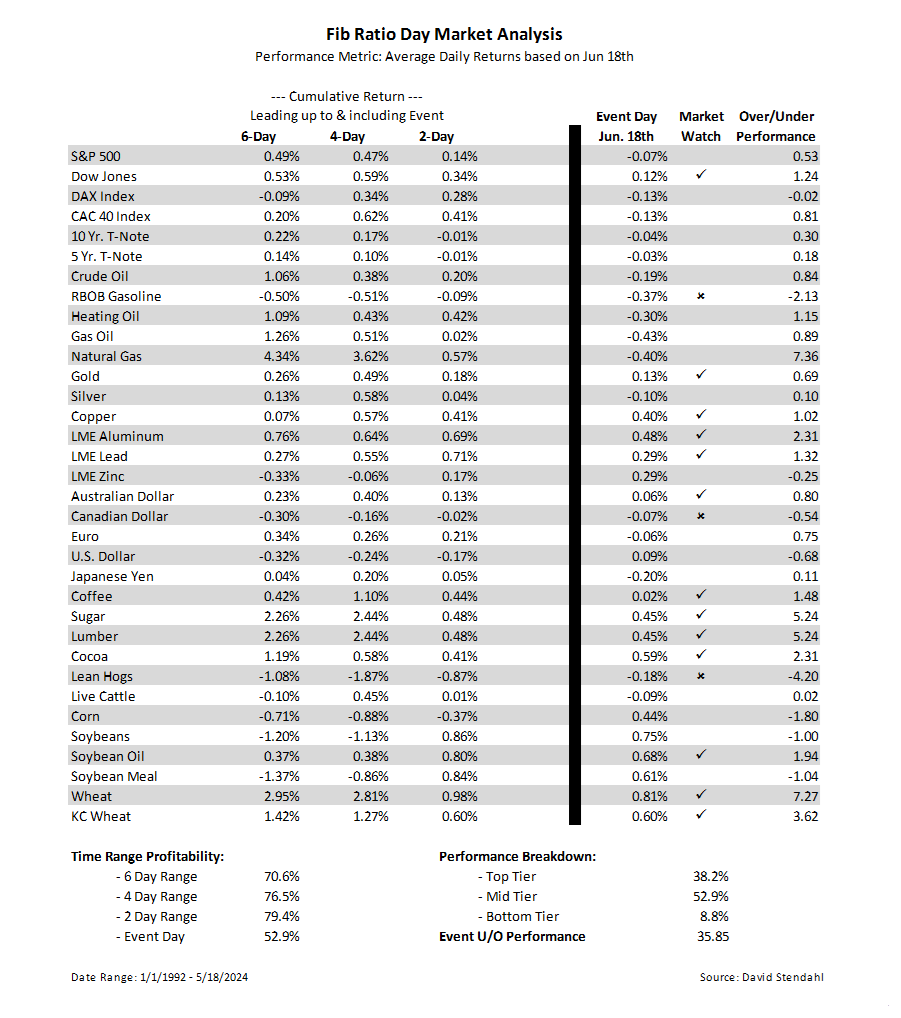
How do the markets perform leading up to Fibonacci Ratio Day? The analysis table below breaks down each of the 30+ markets into four separate trading periods. These time frames span 6-days, 4-day, 2-days, and the event day itself. The return performance for each time frame is measured against its normal performance during the year to calculate a final over or underperformance return. This metric quantifies, in percentage points, the advantages or disadvantages associated with Fibonacci Ratio Day. Markets highlighted with a checkmark or an “x” should be closely monitored for potential strength or weakness heading into the event.
Calendar Breakdown by Events
All trading involves risk. Leveraged trading has large potential rewards, but also large potential risk. You must be aware of the risks and be willing to accept them in order to invest in the futures and options markets. Don’t trade with money you can’t afford to lose. This is neither a solicitation nor an offer to Buy/Sell futures or options. No representation is being made that any account will or is likely to achieve profits or losses similar to those discussed. The past performance of any trading system or methodology is not necessarily indicative of future results.
Our strategies have not been developed based on knowledge of or with reference to your particular circumstances, such as financial position, goals, risk-reward preferences, tax situation, brokerage arrangement, investment or trading experience, and so forth. Hence no content or model published here constitutes a recommendation that any particular security, portfolio of securities, transaction, or investment strategy is suitable for any specific person. You alone are solely responsible for determining whether any investment, security or strategy, or any other product or service, is appropriate or suitable for you based on your investment objectives and personal financial situation. More