As systems traders, we spend a great deal of time evaluating and monitoring our systems. It’s a constant process that has our computers running 24/7/365. Our testing includes not only the active systems we post on our site, but our entire arsenal of systems. This amounts to 2,268 tests, as we monitor nine systems on seven time frames across 36 markets. It’s a never-ending process because once a system is complete, it’s placed back into the mix for re-testing in the future.
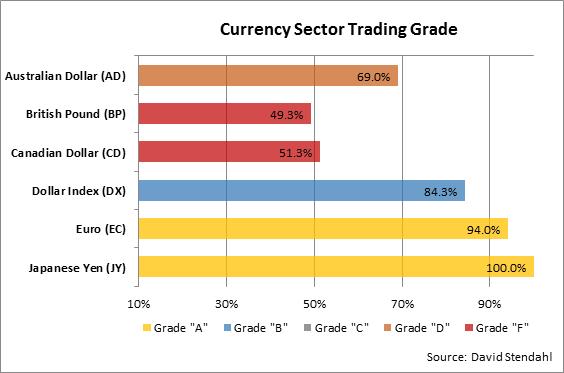
A by-product of all this testing has been the accumulation of a huge database of trading results for the markets we track. Each market has been graded based on its performance over various trading styles (trend, momentum and pattern) and time frames (30/45/60/90/120/daily/weekly bars). Markets have been judged on profitability, performance consistency and various risk metrics, resulting in a trading grade of A, B, C, D or F.
A final grade of “A” does not suggest that the market is a foolproof, can’t lose, guarantee moneymaker … NO, far from it. It simply reflects that the market is receptive to systematic trading and that the trading results have been relatively consistent and stable over time.
The results for the currency markets are shown below.

So how do we use market grading in the real world …
If you are new to trading, you might consider focusing on markets that are easier to trade. These are markets that have smoother trends or less volatile swings. These price characteristics may be difficult to see in the charts, but they show up with great clarity in the grading process. Seasoned traders, with larger portfolios, might look to increase exposure in markets that are more receptive to systematic trading. Bottom line: If it’s good for our diverse basket of systems, it just might benefit your trading as well.
Traders gravitate towards certain markets and avoid others. Let us know if you agree with our market grades. We would like to hear from you. Contact Info


