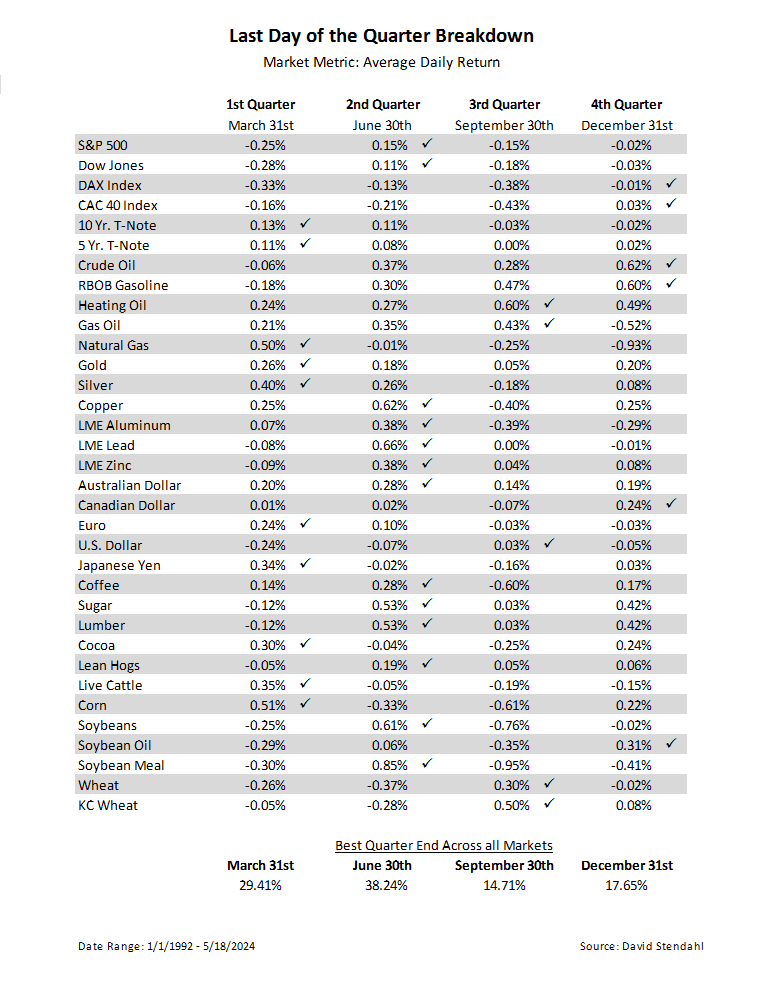
Market Comparison Breakdown: Quarterly End
The fiscal quarter-end can see a tremendous amount of rebalancing from portfolio managers. It’s the last day to clean up positions before the new trading quarter begins. Let’s compare the final day of Q1 March 31, Q2 June 30th, Q3 September 30, and Q4 December 31st to see which quarter offers the best/worst trading performance across a wide variety of global futures markets.
How does portfolio window dressing affect the last trading day of the quarter.
Calendar Breakdown by Events
All trading involves risk. Leveraged trading has large potential rewards, but also large potential risk. You must be aware of the risks and be willing to accept them in order to invest in the futures and options markets. Don’t trade with money you can’t afford to lose. This is neither a solicitation nor an offer to Buy/Sell futures or options. No representation is being made that any account will or is likely to achieve profits or losses similar to those discussed. The past performance of any trading system or methodology is not necessarily indicative of future results.
Our strategies have not been developed based on knowledge of or with reference to your particular circumstances, such as financial position, goals, risk-reward preferences, tax situation, brokerage arrangement, investment or trading experience, and so forth. Hence no content or model published here constitutes a recommendation that any particular security, portfolio of securities, transaction, or investment strategy is suitable for any specific person. You alone are solely responsible for determining whether any investment, security or strategy, or any other product or service, is appropriate or suitable for you based on your investment objectives and personal financial situation. More