Rolling 12 month CAGR Comparison (5 Year): Meats
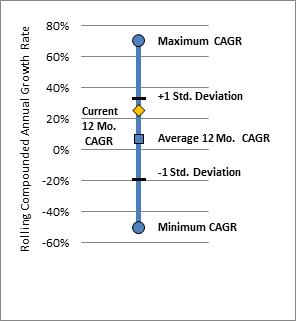
Rolling CAGR Meat Profiles: The rolling Compounded Annual Growth Rate (CAGR) analysis provides a historic perspective of various performance levels for an individual market. CAGR is a measure of reward. Yet by itself it only measures performance over a single period of time. Our rolling ten year analysis takes 60 performance snap shots with each data point calculated based on a 12 month Compounded Annual Growth Rate. With rolling data points, market performance can be viewed within a single vertical line profile.The vertical line profile, shown right, provides four main performance levels.
- Extreme performance, represented by circles, shows the maximum and minimum 12 month CAGR over the test period.
- Superior performance, represented by black bold lines, shows historic CAGR levels that are +/- 1 Standard Deviation away from the average.
- Average performance, represented by the square, provides perspective on the norm.
- The current 12 month CAGR, represented by the yellow diamond shows recent performance relative to the past ten years.The vertical line profile provides insight into performance greater than any single CAGR point.
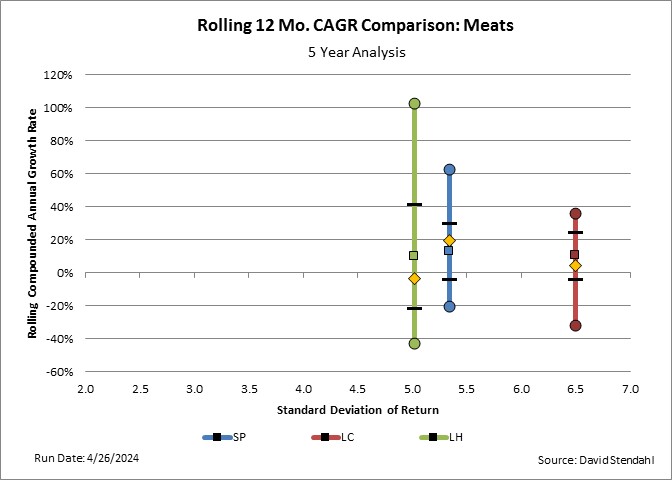
Additionally the sector graphic below compares Meat markets against themselves and relative to the S&P 500 Index. The same vertical line profile is created for each market within the sector. The placement of the markets profile on the horizontal axis is based on the markets Standard Deviation of Monthly return over the test period. Markets with larger deviations in their return stream will appear further to the right; while those will smaller deviations will appear further to the left. With all things equal, focus on the markets with smaller deviation figures … they might be better suited for a portfolio than those that are more volatile.
Rolling 12 Month CAGR Comparison (5 Year Analysis): Meats
Market Symbols
| LC: | Live Cattle |
| LH: | Lean Hogs |
| SP: | S&P 500 Index |
Definitions:
- Compounded Annual Growth Rate (CAGR) measures the growth of an investment as if it had grown at a steady rate on an annually compounded basis.
- Rolling CAGR combines small 12 month performance figures into a larger data stream that spans the entire time analysis period.
- Standard Deviation of Return measures (as its name implies) the deviation associated with monthly return figures (not CAGR) over the test period.


