
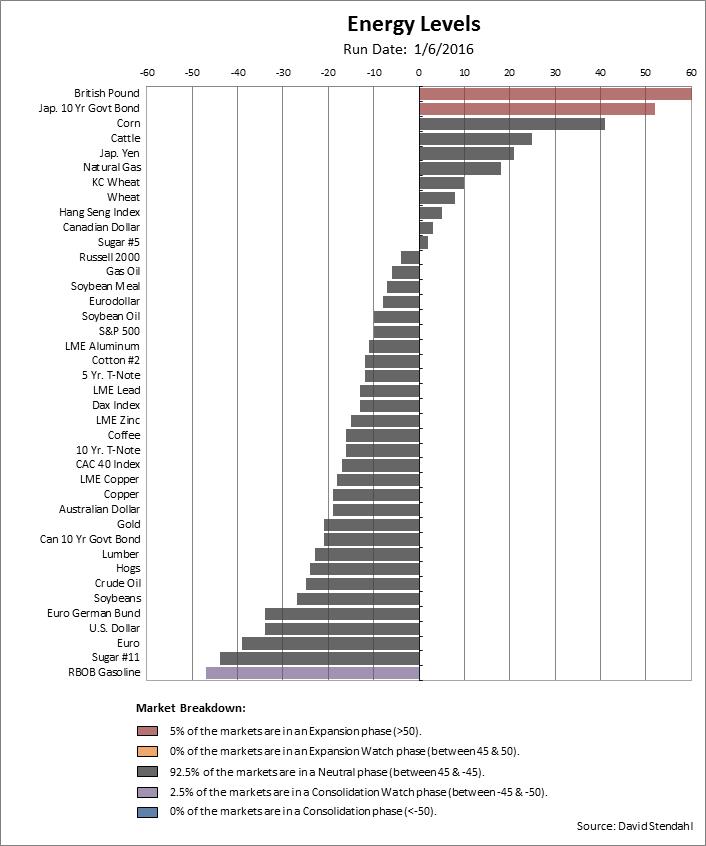
RBOB Gasoline has been in a tight consolidation since September 2015 and is now beginning to show signs of a breakout to the upside. Of all the market we track, RBOB Gasoline has the lowest Energy Level with a reading of -60 (shown in Blue). This low reading indicates a prolonged sideways consolidation.
This consolidation is evident by the daily bar chart below, which shows the two sets of yellow bars; one ranging form mid September – mid October and the second ranging from mid December to present. Together these two phases show a market that has gone sideways for a prolonged period. Like a spring that is wound up … eventually it’s going to expand. Our Energy Level reading for RBOB Gasoline is now showing early signs of slowing which suggesting a breakout from current levels.

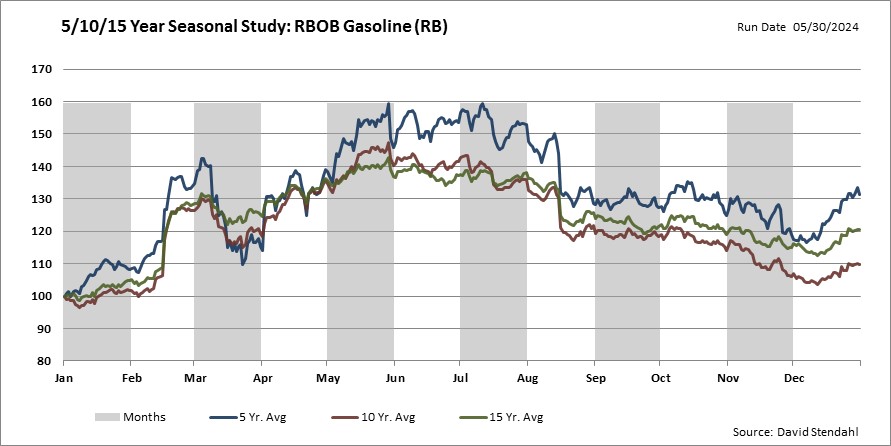
Historically our seasonal 5/10/15 year charts suggest breakouts from considerations periods in January typically occur to the upside. Should RBOB Gasoline breakout higher; we might expect the surge to last until mid March before we see the next consolidation period.
Keep a close eye on RBOB in the coming weeks. As always … trade at your own risk and analysis.
We do not currently offer signals for RBOB Gasoline but you are welcome to monitor our systems as they trade Crude Oil.