
When you review the performance of a market, you typically focus on Percent Return or Point Value Change. We all do it because we have been trained to look at leaderboards to find out which markets made the biggest moves up or down.
The problem with these lists is that they focus on absolute moves and not relative moves. Certain volatile markets see 3% moves over a week on a regular basis, while other markets rarely see this type of move over a year. Therefore, quiet, less volatile markets rarely make the top or bottom of any leaderboard.
To provide our clients with a broader prospective on returns, we offer Weekly and Monthly leaderboards based on Conditional VaR (CVaR) values. CVaR is a statistical measure that portfolio managers use to define risk. In the case of CVaR, if it’s broken, something noteworthy has occurred in the market.
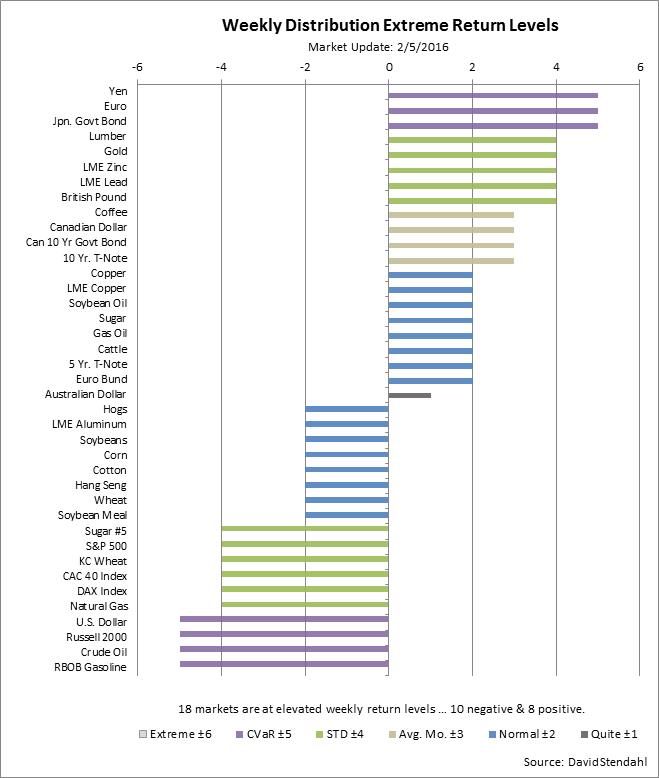
If you want to know which markets are making big moves relative to their normal movement, then simply look for markets above or below their ±CVaR levels. These highlighted markets, shown in Chart 1, are currently experiencing major moves relative to their three-year history. We update both our Weekly and Monthly CVaR leaderboards nightly. These charts are located in main menu under Performance – Weekly or Monthly Distribution.
Chart 1: Relative Return Leaderboard
Show me the data …
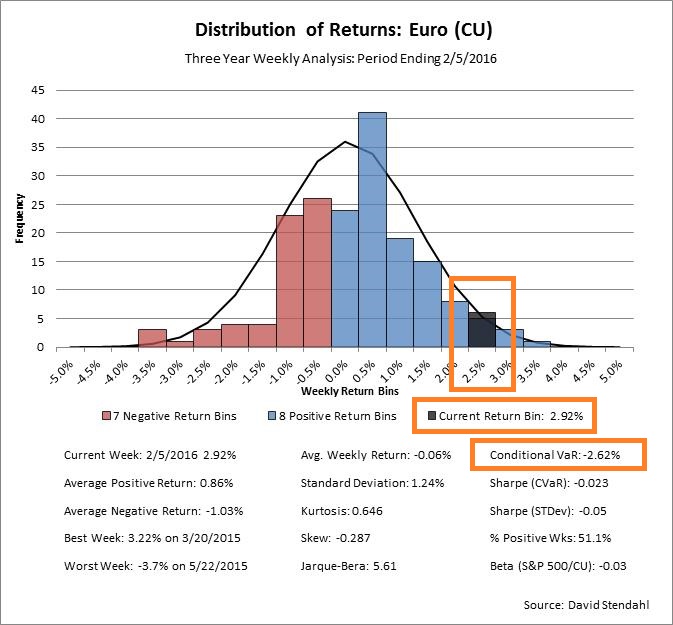
If you are interested in greater detail, we also offer a distribution chart for all the markets we track. We have highlighted three areas on the Euro distribution chart shown below. The Current Bin provides a snapshot for Euro’s weekly percent return. The Conditional VaR box indicates the extreme percent return level relative to the individual market. So last week the Euro was up 2.92%, which is above its ±2.62% CVaR return level and means it had a big move for the week. The third highlighted section indicates the current weeks performance shown as a grey box on the chart. So whether you prefer to look at numbers or the distribution chart, both reflect a market that made a big positive move for the week. Did you notice?
Chart 2: Euro Return Distribution Chart
In the near future, we will present webinars focused on the other metrics found at the bottom of our distribution charts. All of these stats provide perspective into the personality type of the market. Once you have categorized the personality of a market, it’s easier to trade.