
A number of the grain markets are currently in oversold territory according to our Elastic Level (EL) indicator. Corn, in particular, is strongly oversold with a current reading of -8.25 as of Friday’s close. As technicians know … a market that is oversold can remain in oversold territory for extended periods. For this reason we use a trigger that tells us that the oversold territory is likely to reverse. In this instance, The Elastic Level indicator for Corn has formed a pivot low, which suggests a slowing to its oversold condition.
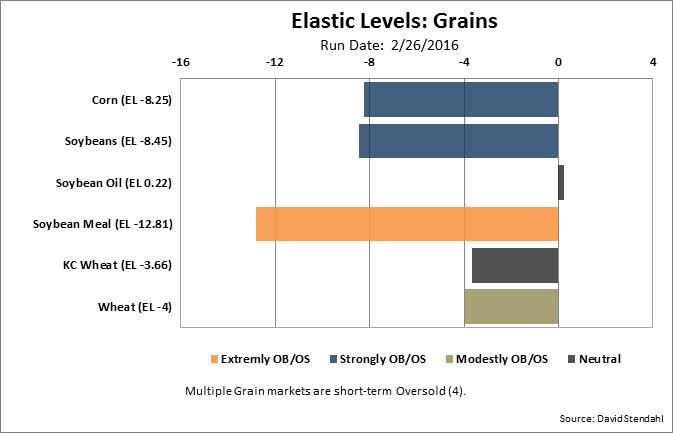
With Corn off 2.64% last week and our Elastic Level indicators suggesting stability … what’s the potential safety net level for Corn in the near term? Our SigXSR indicator, which measures the strength of support and resistance levels, shows very strong support for Corn at 353.25.
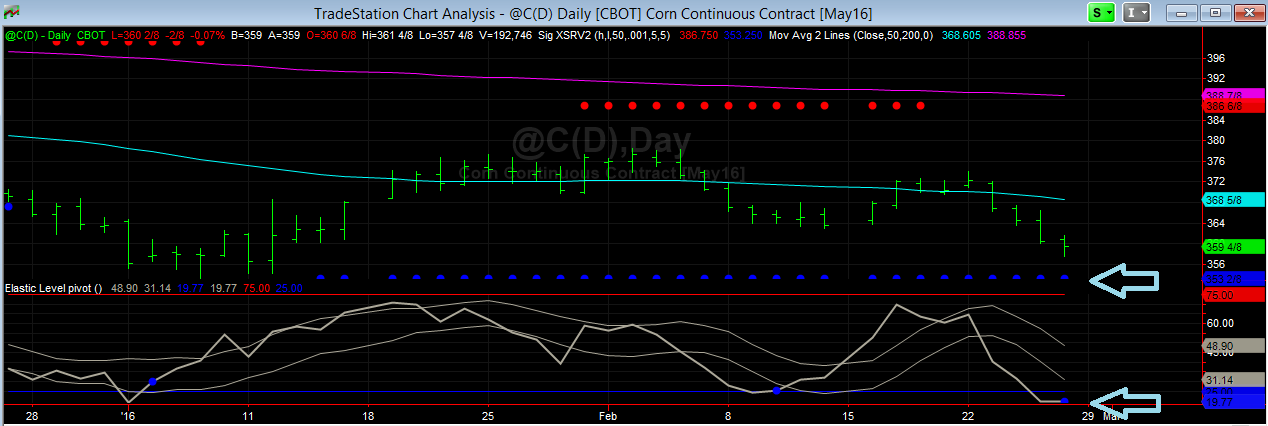
The chart above highlights the two indicators with two cyan arrows. The top arrow points at our SigXSR support level. The blue dotted line clearly shows support for Corn at 353.25 extending back to January 7th. The bottom cyan arrow points at a blue dot which signifies the pivot low was set by our Elastic Level indicator. As a point of reference, two other Elastic Level pivots lows triggered in Corn; one on February 10th and the other on January 5th. In each case the market based and rallied from oversold territory. Let’s see what Corn does in the coming days and weeks.
Note … we will be presenting webinars on these indicators in the coming months to provide greater insight on how to improve trading with our dynamic indicators.
What are the systems doing …
As always it’s best to track our Corn systems. Current net signal results for Corn