Depth Gauge Levels
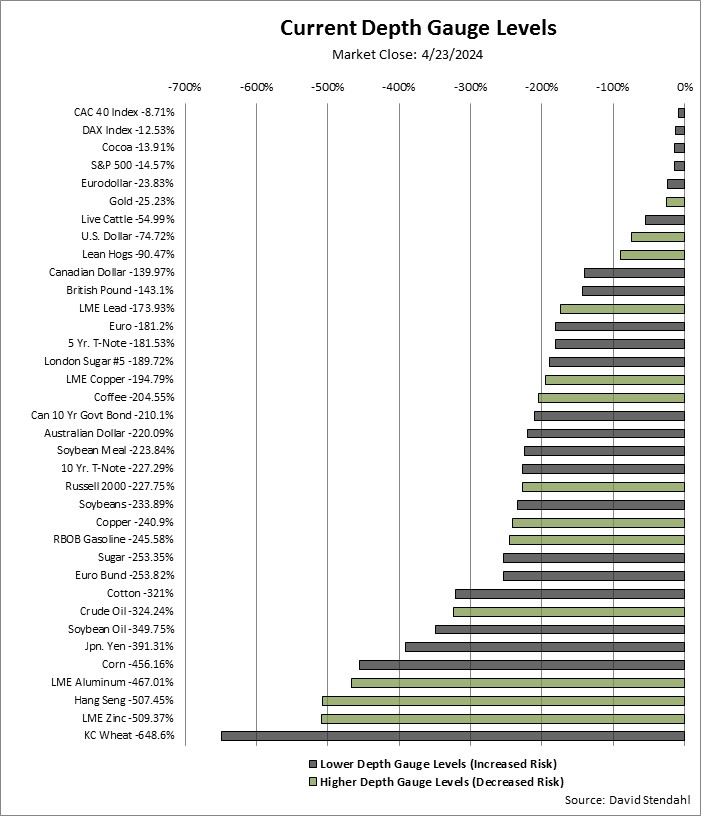
The Depth Gauge indicator measures risk … specifically drawdown risk over time. Markets with drawdowns that are long in duration and big in magnitude will have lower Depth Gauge levels. Markets at the bottom of the list have been suffering through an extended periods of drawdown. While markets at the top of the list have been trading near new highs with relative small drawdowns. The questions is … will the good times last for those at the top and pain continue for those at the bottom? A long term contrarian might very well use this list for trading ideas. To help identify markets on the move up or down the list, we have included bar chart color coding for Depth Gauge direction on a week-over-week basis. Keep in mind the lower the Depth Gauge level the more pressure or risk exposed to the market.
- Grey: Markets with a Depth Gauge that decreased in value and took on MORE risk.
- Green: Markets with a Depth Gauge that Increased in value and took on LESS risk.
Depth Gauge Level Comparison: