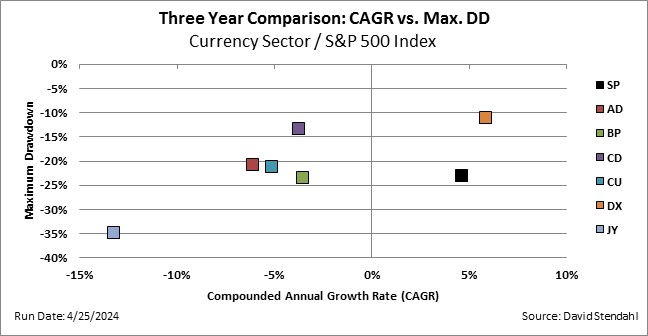
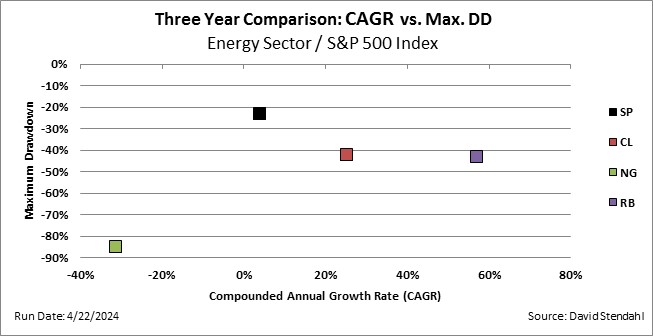
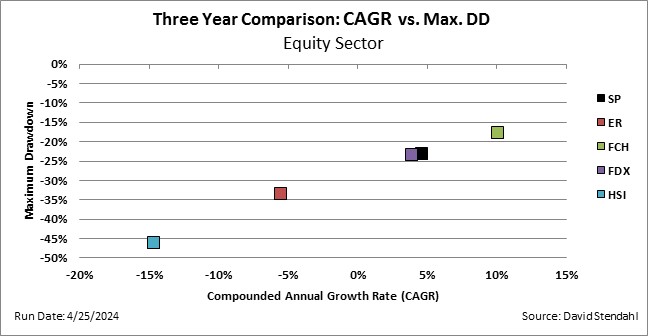
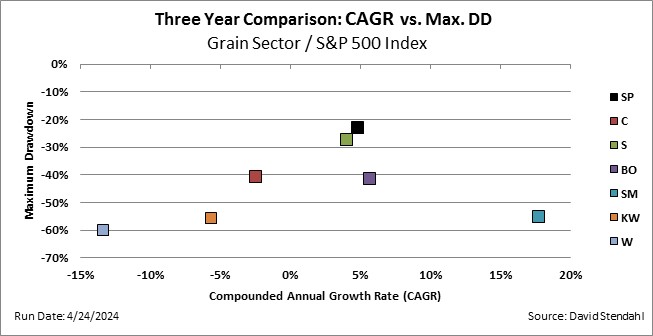
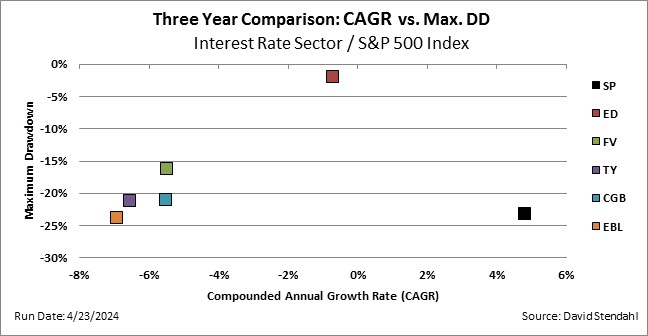
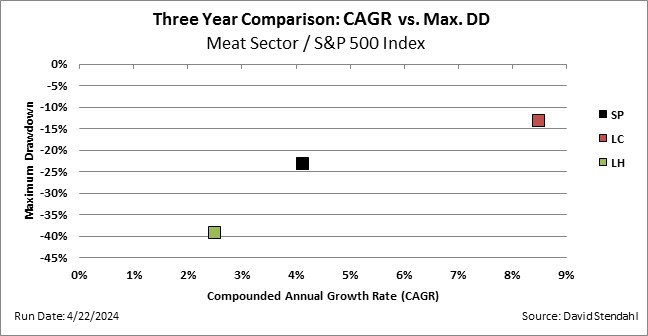
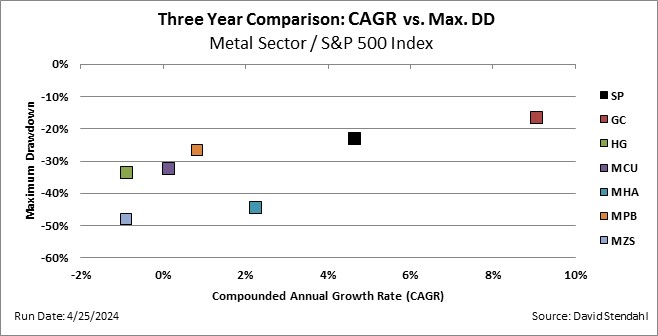
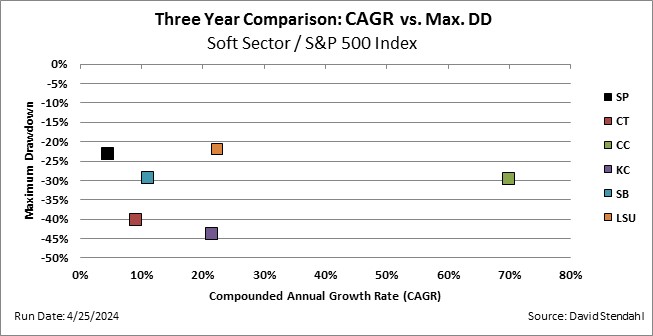
CAGR vs Max. Drawdown Comparison:
Before investing in any market it’s best to gain some perspective into the markets risk reward profile. How much reward does the market generate given a measure of risk? In this 3-year study, we define reward as Compounded Annual Growth Rate (CAGR) and risk as Maximum Drawdown. The scatter chart below uses reward for its horizontal axis and risk for its vertical axis. Based on this set-up, markets with the highest rewards and lowest risk levels will be found in the upper right portion of the chart.
Definitions:
- Compounded Annual Growth Rate (CAGR) measures the growth of an investment as if it had grown at a steady rate on an annually compounded basis.
- Maximum Drawdown measures the largest peak-to-valley loss based on monthly return data.
Sector Breakdown based on CAGR vs Max. Drawdown: