Diversification Strength Overview
Crude Oil
S&P 500 Index
Ten Year Notes
Live Cattle
Intermarket Analysis Cheat Sheet
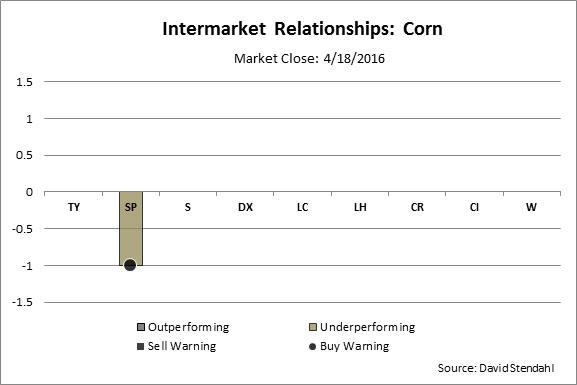
The charts below provide a quick reference for intermarket relationships that are currently at extreme levels.
Overview:
- Gray Bars signify an outperforming intermarket relationship.
- The Sell Warning, shown as a square, signifies that the outperforming disparity between the two markets is beginning to weaken.
- Tan Bars signify an under performing intermarket relationship.
- The Buy Warning, shown as a circle, signifies that the under performing disparity between the two markets is beginning to reverse.