Measuring Opportunity with the Trend Level Indicator:
Performance for any given year is a function of seizing available opportunity within any investment arena. The opportunity can be demonstrated using a sailboat analogy. The stronger and longer the wind blows the faster and further the sailboat should move. Conversely, in the absence of wind, obviously, we would not expect movement. The best sailboat in the world is not going to go anywhere without some sort of wind. Expanding the analogy, it is normal for winds to be blowing in most markets (trends) and occasionally for there to be strong winds in some markets (sustained trends).
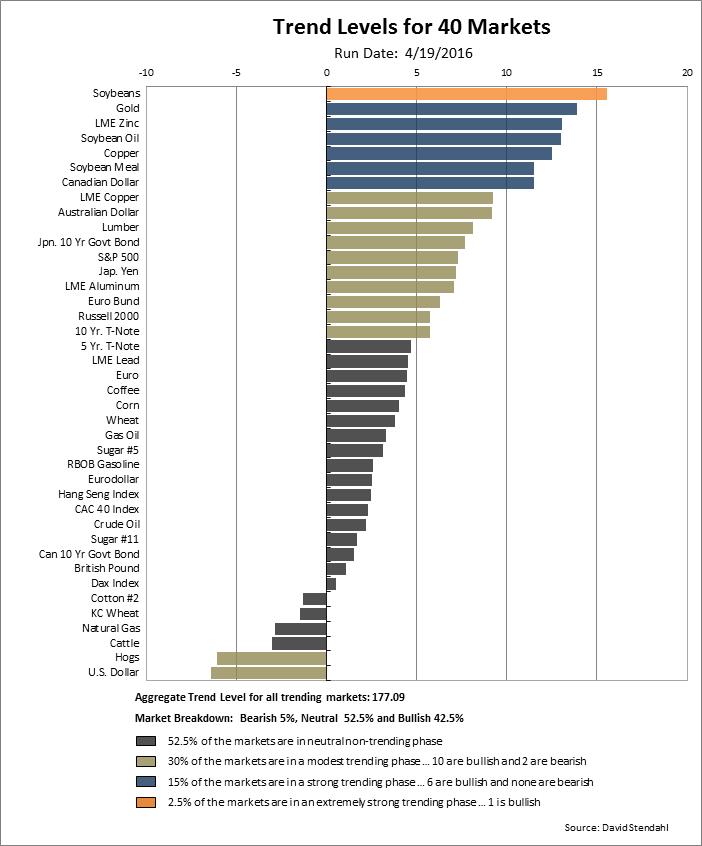
In general, TL values greater than +5 indicate the presence of a noteworthy up move (or up trend) and TL values less than -5 indicates the presence of a noteworthy down move (or down trend) in the markets. In addition, the average TL reading for the 10 strongest up trending markets (Top 10) and the 10 strongest down trending markets (Bottom 10) are studied to measure the presence or absence of noteworthy price movement or trends across our portfolio. Our extensive research shows that it is not unusual for our markets to experience numeric values less than 5 (positive or negative) for sustained periods. However, it is unusual for most markets during the same time period to experience these low numbers simultaneously.
Are the markets trending higher or lower and how strong are these trends? To evaluate the markets, we use the Trend Level indicator to quantify the true power behind the trends of individual markets. The Trend Level table below is organized from the strongest bull to bear trends providing a technical overview for many of the markets we monitor.
Trend Level (TL) Level Descriptions:
- Bullish trending markets greater than +5
- Bearish trending markets less than -5
- Neutral markets between +5 and -5
Trend Level Comparison Chart: 40 Futures Markets