Seasonal Depth: 20 Year Comparison
Seasonal tendencies change over time for every market. The question is do they change dramatically or subtly? The seasonal depth analysis looks to answer this question by comparing the correlations of various seasonal time frames. Markets with low correlations between time frames change dramatically and offer little stability, while markets with high correlations change subtly and offer greater consistency over time.
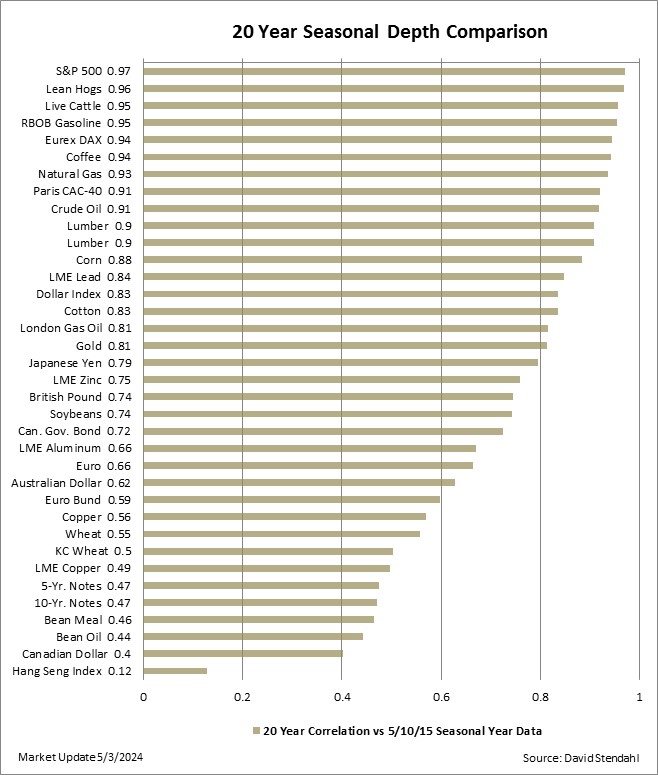
The seasonal depth analysis below compares the 20 year seasonal chart for each individual market against its own 5/10/15 year seasonal charts. Markets high on the list offer greater seasonal consistency over time.
Seasonal Depth: 20 Year Comparison
All trading involves risk. Leveraged trading has large potential rewards, but also large potential risk. You must be aware of the risks and be willing to accept them in order to invest in the futures and options markets. Don’t trade with money you can’t afford to lose. This is neither a solicitation nor an offer to Buy/Sell futures or options. No representation is being made that any account will or is likely to achieve profits or losses similar to those discussed. The past performance of any trading system or methodology is not necessarily indicative of future results.
Our strategies have not been developed based on knowledge of or with reference to your particular circumstances, such as financial position, goals, risk-reward preferences, tax situation, brokerage arrangement, investment or trading experience, and so forth. Hence no content or model published here constitutes a recommendation that any particular security, portfolio of securities, transaction, or investment strategy is suitable for any specific person. You alone are solely responsible for determining whether any investment, security or strategy, or any other product or service, is appropriate or suitable for you based on your investment objectives and personal financial situation. More