Energy Levels for 40 Futures Markets
Measuring explosiveness of the markets with the Energy Level Indicator
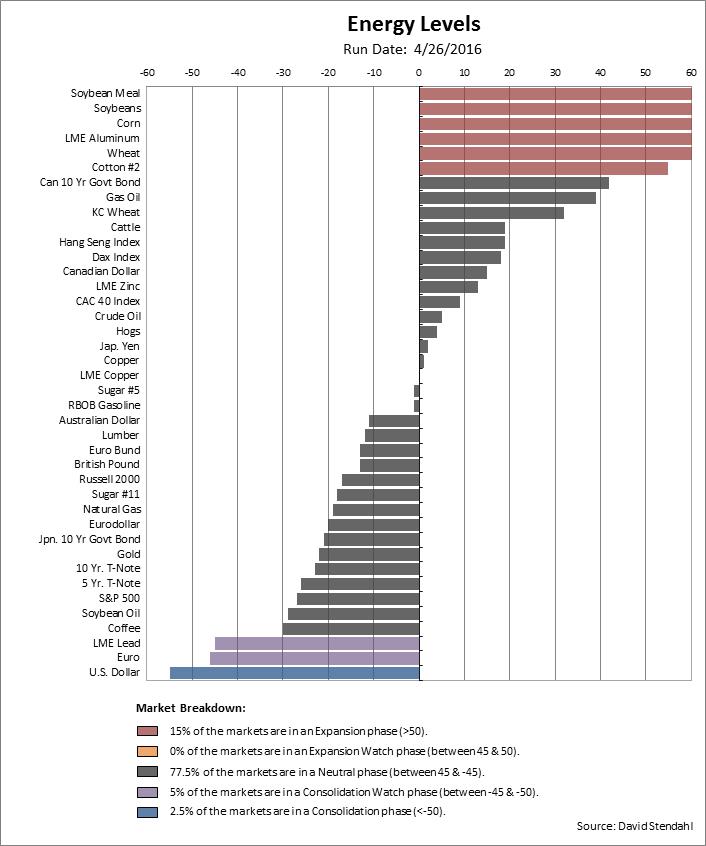
Ever wonder why certain markets explode into strong trending phases while others fizzle out? The answer is energy. The more energy built up during a consolidation phase the more energy the market has to push itself into the next short-term bull or bear trend. An energy level reading less than -45, suggest that a market is in some form of a consolidation phases and should be closely monitored for an explosive move. On the flip side … a market that has recently rallied or fallen, is in an expansion phase. An energy level reading greater than +45, suggests that a market is in some form of an expansion phase and should be closely watched for reversals. An expansion phase can continue in the direction of the bull/bear explosion but it’s most likely running on fumes … so closely monitor the market for pivot high/low points and support/resistance levels as a potential short-term reversal point may be close at hand.
Note: The Energy Level chart does not provide buy sell signals … it simple lists markets that are in a consolidation or expansion mode.
Energy Level Descriptions:
- Expansion Phase >50
- Expansion Watch between 45 & 50
- Neutral Phase between -45 & 45
- Contraction Watch between -45 & -50
- Contraction Phase < -50
Energy Level Comparison Chart: