Intermarket Analysis: Corn
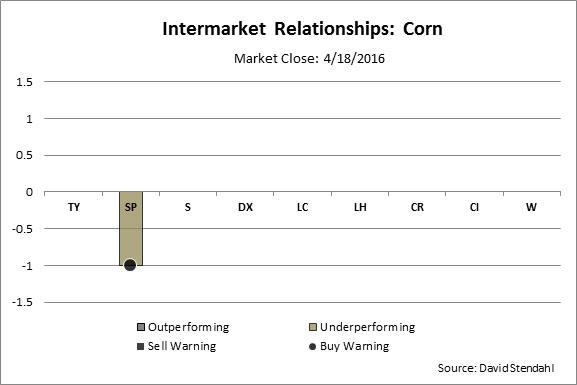
Intermarket Analysis looks at the relationship between two markets … in this case Corn and a variety of other markets. The chart below provides a quick Corn reference to those intermarket relationships that are currently at extreme levels. As always … trade at your own risk and analysis.
Chart Overview:
- Gray Bars (↑) signify an outperforming intermarket relationship between Corn and other markets.
- The Sell Warning, shown as a square, signifies that the outperforming disparity between the two markets is beginning to weaken.
- Tan Bars (↓) signify an under performing intermarket relationship between Corn and other markets.
- The Buy Warning, shown as a circle, signifies that the under performing disparity between the two markets is beginning to reverse.
Corn Relationship Status:
For a detailed intermarkt chart related to Corn … click on any of the market links below.
Depth Gauge
Are the markets bullish or bearish?
Take a closer look at the directional play for all the markets.
Depth Gauge