Top Performing Monthly Comparison: S&P 500 Index vs. London Gas Oil (LGO)
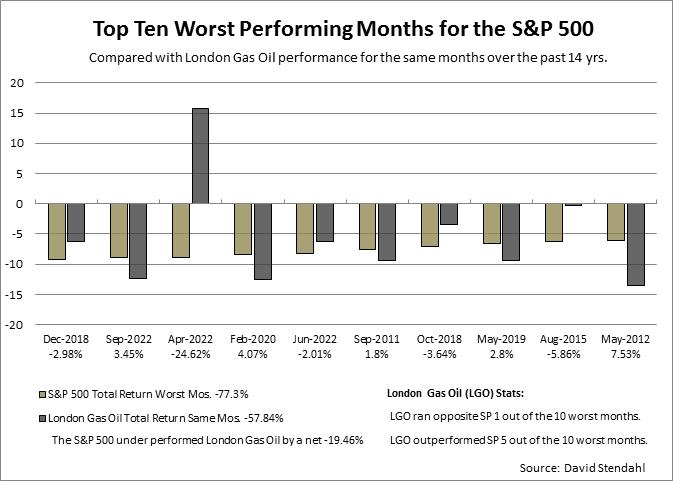
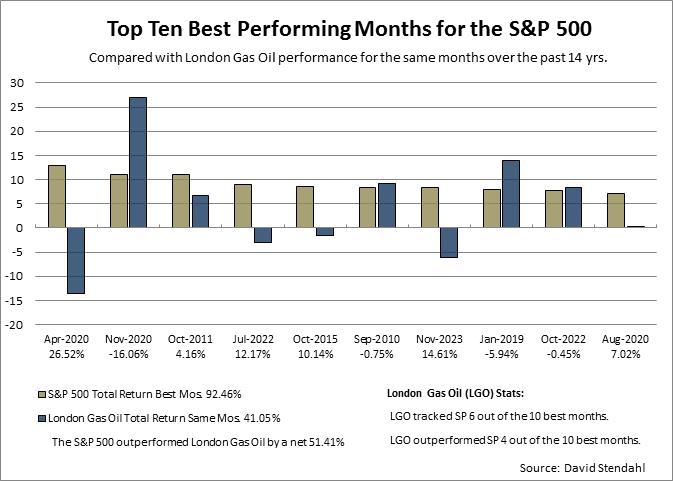
When big monthly moves occur in the S&P 500 Index, how does London Gas Oil perform? The fourteen-year study below reviews the top ten best and worst performing months for the S&P 500 Index and compares them with London Gas Oil returns for the same months. Comparison results between the markets can be found at the bottom of each of the two charts. The results include: month-to-month, total and net performance differences between the two markets. Additionally, the study results include a month-to-month directional comparison and an over/under performance tracking of monthly returns. These charts provide perspective on the performance of London Gas Oil when the S&P 500 makes larger than normal moves … whether those moves are positive or negative.
Top Ten Best Performing Months for the S&P 500 vs. London Gas Oil
Top Ten Worst Performing Months for the S&P 500 vs. London Gas Oil